

Glutamine synthetase in muscle is required for glutamine production during fasting and extrahepatic ammonia detoxification
- PMID: 20064933
- PMCID: PMC2843202
- DOI: 10.1074/jbc.M109.092429
Glutamine synthetase in muscle is required for glutamine production during fasting and extrahepatic ammonia detoxification
Abstract
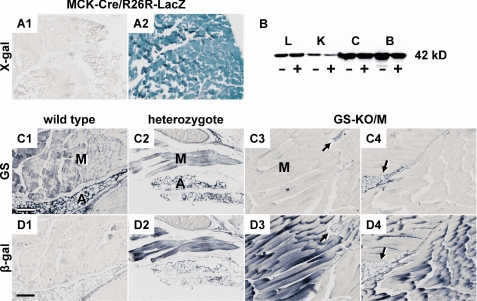
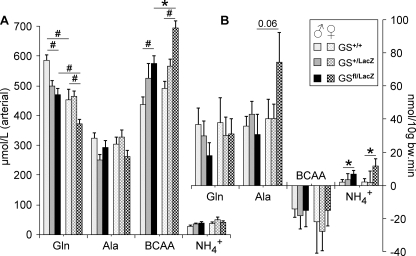
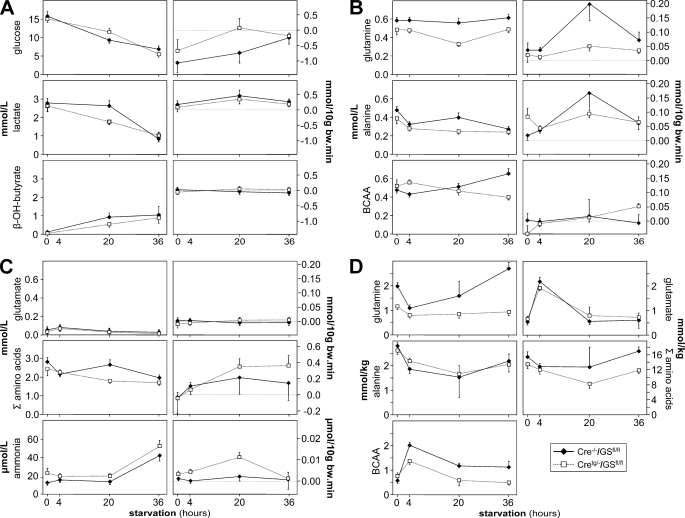
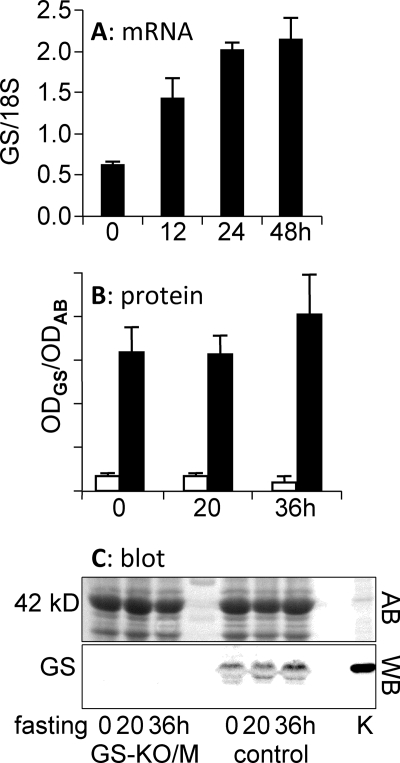
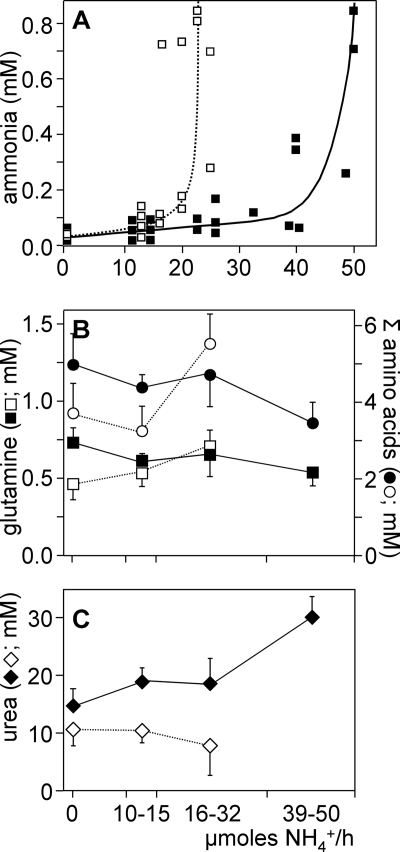
The main endogenous source of glutamine is de novo synthesis in striated muscle via the enzyme glutamine synthetase (GS). The mice in which GS is selectively but completely eliminated from striated muscle with the Cre-loxP strategy (GS-KO/M mice) are, nevertheless, healthy and fertile. Compared with controls, the circulating concentration and net production of glutamine across the hindquarter were not different in fed GS-KO/M mice. Only a approximately 3-fold higher escape of ammonia revealed the absence of GS in muscle. However, after 20 h of fasting, GS-KO/M mice were not able to mount the approximately 4-fold increase in glutamine production across the hindquarter that was observed in control mice. Instead, muscle ammonia production was approximately 5-fold higher than in control mice. The fasting-induced metabolic changes were transient and had returned to fed levels at 36 h of fasting. Glucose consumption and lactate and ketone-body production were similar in GS-KO/M and control mice. Challenging GS-KO/M and control mice with intravenous ammonia in stepwise increments revealed that normal muscle can detoxify approximately 2.5 micromol ammonia/g muscle.h in a muscle GS-dependent manner, with simultaneous accumulation of urea, whereas GS-KO/M mice responded with accumulation of glutamine and other amino acids but not urea. These findings demonstrate that GS in muscle is dispensable in fed mice but plays a key role in mounting the adaptive response to fasting by transiently facilitating the production of glutamine. Furthermore, muscle GS contributes to ammonia detoxification and urea synthesis. These functions are apparently not vital as long as other organs function normally.
Figures
Similar articles
-
FOXO1 activates glutamine synthetase gene in mouse skeletal muscles through a region downstream of 3'-UTR: possible contribution to ammonia detoxification.Am J Physiol Endocrinol Metab. 2014 Sep 15;307(6):E485-93. doi: 10.1152/ajpendo.00177.2014. Epub 2014 Jul 29. Am J Physiol Endocrinol Metab. 2014. PMID: 25074987
-
Pivotal role of glutamine synthetase in ammonia detoxification.Hepatology. 2017 Jan;65(1):281-293. doi: 10.1002/hep.28852. Epub 2016 Nov 12. Hepatology. 2017. PMID: 27641632
-
Proximal tubule glutamine synthetase expression is necessary for the normal response to dietary protein restriction.Am J Physiol Renal Physiol. 2017 Jul 1;313(1):F116-F125. doi: 10.1152/ajprenal.00048.2017. Epub 2017 Mar 22. Am J Physiol Renal Physiol. 2017. PMID: 28331060 Free PMC article.
-
Glutamine synthetase in brain: effect of ammonia.Neurochem Int. 2002 Aug-Sep;41(2-3):123-42. doi: 10.1016/s0197-0186(02)00033-5. Neurochem Int. 2002. PMID: 12020613 Review.
-
Astrocyte glutamine synthetase: pivotal in health and disease.Biochem Soc Trans. 2013 Dec;41(6):1518-24. doi: 10.1042/BST20130237. Biochem Soc Trans. 2013. PMID: 24256247 Review.
Cited by
-
Histone methyltransferase MLL4 controls myofiber identity and muscle performance through MEF2 interaction.J Clin Invest. 2020 Sep 1;130(9):4710-4725. doi: 10.1172/JCI136155. J Clin Invest. 2020. PMID: 32544095 Free PMC article.
-
KRAS, A Prime Mediator in Pancreatic Lipid Synthesis through Extra Mitochondrial Glutamine and Citrate Metabolism.Int J Mol Sci. 2021 May 11;22(10):5070. doi: 10.3390/ijms22105070. Int J Mol Sci. 2021. PMID: 34064761 Free PMC article. Review.
-
Targeting glutamine metabolism slows soft tissue sarcoma growth.Nat Commun. 2020 Jan 24;11(1):498. doi: 10.1038/s41467-020-14374-1. Nat Commun. 2020. PMID: 31980651 Free PMC article.
-
Assessment of prenatal cerebral and cardiac metabolic changes in a rabbit model of fetal growth restriction based on 13C-labelled substrate infusions and ex vivo multinuclear HRMAS.PLoS One. 2018 Dec 27;13(12):e0208784. doi: 10.1371/journal.pone.0208784. eCollection 2018. PLoS One. 2018. PMID: 30589837 Free PMC article.
-
Rewiring of Glutamine Metabolism Is a Bioenergetic Adaptation of Human Cells with Mitochondrial DNA Mutations.Cell Metab. 2018 May 1;27(5):1007-1025.e5. doi: 10.1016/j.cmet.2018.03.002. Epub 2018 Apr 12. Cell Metab. 2018. PMID: 29657030 Free PMC article.
References
-
- Kuhn K. S., Schuhmann K., Stehle P., Darmaun D., Fürst P. (1999) Am. J. Clin. Nutr. 70, 484–489 - PubMed
-
- Biolo G., Zorat F., Antonione R., Ciocchi B. (2005) Int. J. Biochem. Cell Biol. 37, 2169–2179 - PubMed
-
- Curthoys N. P., Watford M. (1995) Annu. Rev. Nutr. 15, 133–159 - PubMed
-
- Heeneman S., Deutz N. E. (1993) Clin. Nutr. 12, 182–190 - PubMed
-
- Olde Damink S. W., de Blaauw I., Deutz N. E., Soeters P. B. (1999) Clin. Sci. 96, 639–646 - PubMed
Publication types
MeSH terms
Substances
LinkOut - more resources
Full Text Sources
Molecular Biology Databases
Research Materials
