

Climatic predictors of the intra- and inter-annual distributions of plague cases in New Mexico based on 29 years of animal-based surveillance data
- PMID: 20065002
- PMCID: PMC2803516
- DOI: 10.4269/ajtmh.2010.09-0247
Climatic predictors of the intra- and inter-annual distributions of plague cases in New Mexico based on 29 years of animal-based surveillance data
Abstract
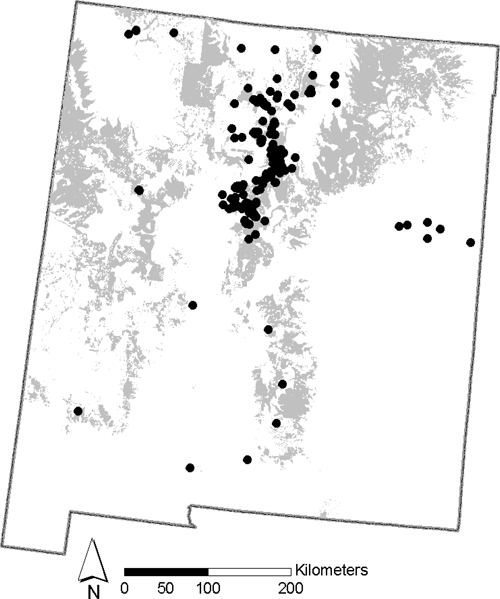
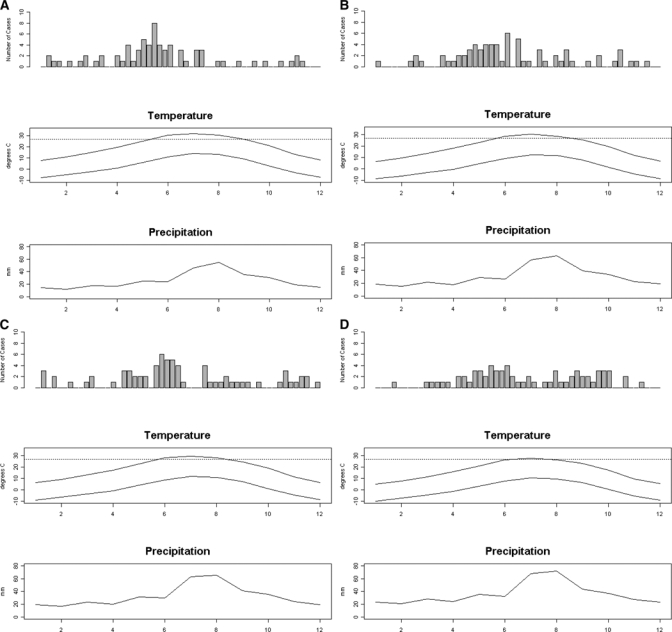
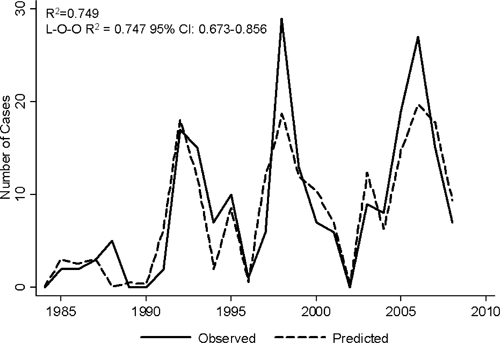
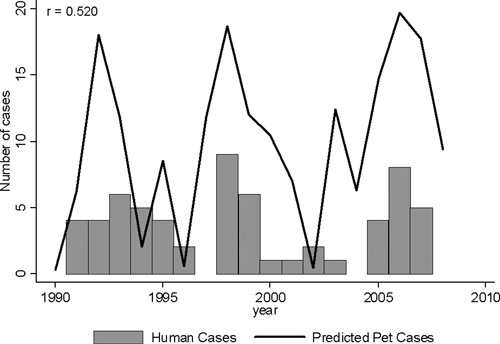
Within the United States, the majority of human plague cases are reported from New Mexico. We describe climatic factors involved in intra- and inter-annual plague dynamics using animal-based surveillance data from that state. Unlike the clear seasonal pattern observed at lower elevations, cases occur randomly throughout the year at higher elevations. Increasing elevation corresponded with delayed mean time in case presentation. Using local meteorological data (previous year mean annual precipitation, total degrees over 27 degrees C 3 years before and maximum winter temperatures 4 years before) we built a time-series model predicting annual case load that explained 75% of the variance in pet cases between years. Moreover, we found a significant correlation with observed annual human cases and predicted pet cases. Because covariates were time-lagged by at least 1 year, intensity of case loads can be predicted in advance of a plague season. Understanding associations between environmental and meteorological factors can be useful for anticipating future disease trends.
Figures
Similar articles
-
Modeling relationships between climate and the frequency of human plague cases in the southwestern United States, 1960-1997.Am J Trop Med Hyg. 2002 Feb;66(2):186-96. doi: 10.4269/ajtmh.2002.66.186. Am J Trop Med Hyg. 2002. PMID: 12135292
-
Incidence of plague associated with increased winter-spring precipitation in New Mexico.Am J Trop Med Hyg. 1999 Nov;61(5):814-21. doi: 10.4269/ajtmh.1999.61.814. Am J Trop Med Hyg. 1999. PMID: 10586917
-
Seasonal fluctuations of small mammal and flea communities in a Ugandan plague focus: evidence to implicate Arvicanthis niloticus and Crocidura spp. as key hosts in Yersinia pestis transmission.Parasit Vectors. 2015 Jan 8;8:11. doi: 10.1186/s13071-014-0616-1. Parasit Vectors. 2015. PMID: 25573253 Free PMC article.
-
Reported cases of human plague infections in the United States, 1970-1991.J Med Entomol. 1993 Jul;30(4):758-61. doi: 10.1093/jmedent/30.4.758. J Med Entomol. 1993. PMID: 8395603 Review.
-
Using syndromic surveillance systems to detect pneumonic plague.Epidemiol Infect. 2010 Jan;138(1):1-8. doi: 10.1017/S0950268809990689. Epub 2009 Aug 24. Epidemiol Infect. 2010. PMID: 19698212 Review.
Cited by
-
Flea-Associated Bacterial Communities across an Environmental Transect in a Plague-Endemic Region of Uganda.PLoS One. 2015 Oct 20;10(10):e0141057. doi: 10.1371/journal.pone.0141057. eCollection 2015. PLoS One. 2015. PMID: 26485147 Free PMC article.
-
Predicting global potential distribution of Peromyscopsylla hesperomys and Orchopeas sexdentatus and risk assessment for invading China under climate change.Front Public Health. 2023 Jan 5;10:1018327. doi: 10.3389/fpubh.2022.1018327. eCollection 2022. Front Public Health. 2023. PMID: 36684875 Free PMC article.
-
Improvement of disease prediction and modeling through the use of meteorological ensembles: human plague in Uganda.PLoS One. 2012;7(9):e44431. doi: 10.1371/journal.pone.0044431. Epub 2012 Sep 14. PLoS One. 2012. PMID: 23024750 Free PMC article.
-
Effects of temperature on the transmission of Yersinia Pestis by the flea, Xenopsylla Cheopis, in the late phase period.Parasit Vectors. 2011 Sep 29;4:191. doi: 10.1186/1756-3305-4-191. Parasit Vectors. 2011. PMID: 21958555 Free PMC article.
-
Revisiting the Relationship between Weather and Interannual Variation in Human Plague Cases in the Southwestern United States.Am J Trop Med Hyg. 2025 Jan 14;112(4):840-844. doi: 10.4269/ajtmh.24-0255. Print 2025 Apr 2. Am J Trop Med Hyg. 2025. PMID: 39808829
References
-
- Gage KL, Kosoy MY. Natural history of plague: perspectives from more than a century of research. Annu Rev Entomol. 2005;50:505–528. - PubMed
-
- Craven RB, Maupin GO, Beard ML, Quan TJ, Barnes AM. Reported cases of human plague infections in the United States, 1970–1991. J Med Entomol. 1993;30:758–761. - PubMed
-
- MMWR Human plague—four states, 2006. MMWR. 2006;55:940–943. - PubMed
-
- Eisen RJ, Enscore RE, Biggerstaff BJ, Reynolds PJ, Ettestad P, Brown T, Pape J, Tanda D, Levy CE, Engelthaler DM, Cheek J, Bueno R, Targhetta J, Montenieri JA, Gage KL. Human plague in the southwestern United States, 1957–2004: spatial models of elevated risk of human exposure to Yersinia pestis. J Med Entomol. 2007;44:530–537. - PubMed
Publication types
MeSH terms
LinkOut - more resources
Full Text Sources
Medical
