. 2010 Mar;30(6):1382-96.
doi: 10.1128/MCB.01290-09. Epub 2010 Jan 11.

Human RECQ1 and RECQ4 helicases play distinct roles in DNA replication initiation

Affiliations

Human RECQ1 and RECQ4 helicases play distinct roles in DNA replication initiation

Saravanabhavan Thangavel et al. Mol Cell Biol. 2010 Mar.

Abstract

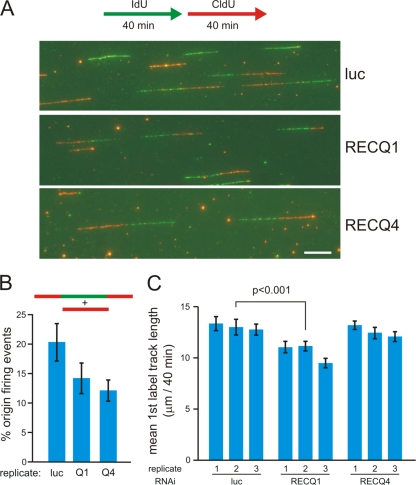
Cellular and biochemical studies support a role for all five human RecQ helicases in DNA replication; however, their specific functions during this process are unclear. Here we investigate the in vivo association of the five human RecQ helicases with three well-characterized human replication origins. We show that only RECQ1 (also called RECQL or RECQL1) and RECQ4 (also called RECQL4) associate with replication origins in a cell cycle-regulated fashion in unperturbed cells. RECQ4 is recruited to origins at late G(1), after ORC and MCM complex assembly, while RECQ1 and additional RECQ4 are loaded at origins at the onset of S phase, when licensed origins begin firing. Both proteins are lost from origins after DNA replication initiation, indicating either disassembly or tracking with the newly formed replisome. Nascent-origin DNA synthesis and the frequency of origin firing are reduced after RECQ1 depletion and, to a greater extent, after RECQ4 depletion. Depletion of RECQ1, though not that of RECQ4, also suppresses replication fork rates in otherwise unperturbed cells. These results indicate that RECQ1 and RECQ4 are integral components of the human replication complex and play distinct roles in DNA replication initiation and replication fork progression in vivo.


Figures

FIG. 1.
FIG. 1.
RECQ1 and RECQ4 helicases are recruited to human origins of DNA replication. (A and B) Genomic regions containing the lamin B2 origin (A) and two GM-CSF replication origins (B) are shown together with the locations of sets of primers (converging arrow pairs) used for quantitative real-time PCR analysis. (C) Quantification of cross-linked lamin B2 origin DNA immunoprecipitated by ChIP from T98G and IMR-90 cells, using the antibodies indicated at the bottom. The inset shows the results of Western analysis after immunoprecipitation of the cross-linked material with specific antibodies against the five human RecQ proteins. ORC2-specific immunoprecipitation served as a positive control, and rabbit IgG immunoprecipitation served as a negative control. Whole T98G cell lysates (WCL) were used to confirm the endogenous expression of the five RecQ helicases. (D) Quantification of cross-linked GM-CSF1 and GM-CSF2 origin DNAs immunoprecipitated by ChIP from T98G cells, using the antibodies indicated at the bottom. Fold enrichments of origin sequences were determined versus nonorigin control sequences, and the dashed line indicates the threshold enrichment level obtained by using a negative-control antibody (normal rabbit IgG). Results are reported as means ± standard errors of the means (SEM) (indicated by error bars) for at least three independent experiments.
FIG. 2.
FIG. 2.
Comparison of association of RECQ1 and RECQ4 helicases with the lamin B2 origin in untreated versus HU-treated cells. T98G cells were treated with 2 mM HU for 24 h. The bar graph shows the quantification of cross-linked lamin B2 origin DNA immunoprecipitated from T98G glioblastoma cells, using antibodies specific to the proteins shown across the bottom. Fold enrichments of origin sequences were determined versus nonorigin control sequences, and the dashed line indicates the threshold enrichment level obtained by using a negative-control antibody (normal rabbit IgG). Results are reported as means ± SEM for at least three independent experiments.
FIG. 3.
FIG. 3.
Cell cycle-dependent association of RECQ1 and RECQ4 with the human lamin B2 replication origin. (A) Western blot analysis of whole-cell extracts of asynchronous T98G cells (AS) or cells from different times after synchronization and release. (B) Cell cycle phase timing was determined by flow cytometry profiling of synchronized T98G cells that had been cultured without serum for 72 h and then sampled over a 28-h time course after the addition of serum. PI, propidium iodide. (C) Quantification of cross-linked lamin B2 origin DNA immunoprecipitated by ChIP from synchronized cells. The key on top indicates the antibodies used for ChIP analyses. Fold enrichments of lamin B2 origin region (B48) DNA over control B13 region DNA are reported for each antibody, where the dashed line indicates the threshold enrichment obtained using a negative-control normal rabbit IgG antibody. Histogram bars report the mean ± SEM for at least three independent experiments for each antibody and cell cycle fraction. (D) Cell cycle-dependent subcellular distribution of RECQ1 and RECQ4. Whole-cell lysates were fractionated to generate cytosolic (S2), soluble nuclear (S3), and chromatin-enriched (P3) fractions, in which protein levels were assessed by Western blotting. Antibodies against p84 and α-tubulin were used as controls for nuclear and cytoplasmic localization, respectively.
FIG. 4.
FIG. 4.
G1- and S-phase-specific loading of RECQ4 and RECQ1 on the lamin B2 origin. Paired columns show flow cytometry profiles of synchronized T98G cells at different times after release from serum starvation, together with bar graphs of cross-linked lamin B2 origin DNA immunoprecipitated by ChIP with antibodies to each of the proteins shown across the bottom of the bar graph at that time point. Histograms report the mean ± SEM for at least three independent experiments at each time point, where fold enrichment of lamin B2 origin region (B48) DNA was determined as described in the legend to Fig. 3.
FIG. 5.
FIG. 5.
Association of RECQ1 and RECQ4 with beta-globin replication origin as a function of origin timing. (A) Genomic region containing the beta-globin replication origin, together with the locations of sets of primers (converging arrow pairs) used for quantitative real-time PCR analysis. (B) Flow cytometry profiling of synchronized K562 cells that had been cultured with mimosine for 24 h and then sampled 3 (early S) and 9 (late S) h after the removal of the drug is shown at the top. The histograms below quantify cross-linked lamin B2 and beta-globin origin DNAs immunoprecipitated by ChIP from early- and late-S-phase-synchronized K562 cells. (C) Flow cytometry profiling of synchronized HeLa cells that had been cultured with mimosine for 24 h and then sampled 3 (early S) and 9 (late S) h after the removal of the drug is shown at the top. The histograms below quantify cross-linked lamin B2 and beta-globin origin DNAs immunoprecipitated by ChIP from early- and late-S-phase-synchronized HeLa cells. Histograms report the means ± SEM for at least three independent experiments, where fold enrichment of lamin B2 and beta-globin origin region DNAs was determined as described in the legends to Fig. 1 and 2.
FIG. 6.
FIG. 6.
Downregulation of RECQ1 and RECQ4 inhibits cellular proliferation and DNA synthesis. (A) Colony-forming efficiency of T98G cells after siRNA-mediated transfection. Plate photos show representative colony formation after plating of cells transfected with siRNA pools directed against the gene named across the top. The cell number plated is indicated by the code along the left, as follows: I, 200 cells/well; II, 400 cells/well; and III, 800 cells/well. Colonies were stained and counted after 7 days of growth to determine colony-forming efficiencies (means ± SEM) for three independent experiments. (B) Western blot analysis of RNAi-mediated depletion of RECQ1 or RECQ4 from T98G cells transfected with an siRNA pool against RECQ1, RECQ4, or luciferase (Luc) at 72 h posttransfection. α-Tubulin was used as a blot control. (C) Flow cytometry profiles of DNA content (x axis; propidium iodide [PI] staining) versus BrdU incorporation (y axis; anti-BrdU immunostaining) 72 h after siRNA transfection. Boxes are labeled to indicate cell cycle phases, where the mean percent S-phase cells is shown in parentheses across the top of each histogram. The bar graph at bottom reports the percentages of G0/G1, S-phase/BrdU-positive, and G2/M cells in cultures that had been transfected with a RECQ1, RECQ4, or luciferase (control) siRNA pool (indicated in the key). Results shown are the means ± SEM for three independent experiments.
FIG. 7.
FIG. 7.
RECQ1 and RECQ4 depletion reduces newly synthesized nascent DNA from early-firing human replication origins. Fold enrichment of nascent DNA from lamin B2 (A) and two GM-CSF (B) origin regions versus that from adjacent nonorigin regions in neutral sucrose gradient fractions was determined for T98G cells depleted of RECQ1 (middle row) or RECQ4 (bottom row) by RNAi transfection and compared to that for controls (luciferase RNAi-transfected cells). Graphs report the means ± SEM for at least three independent experiments.
FIG. 8.
FIG. 8.
RECQ1 and RECQ4 depletion impairs replication factor loading onto chromatin at the start of S phase. (A) Experimental outline for synchronization and release of human T98G cells to generate highly enriched S-phase cell populations. Asynchronous cells were grown for 72 h without serum and then refed, RNAi transfected, and harvested after 24 h for blot analysis. (B) Western blot analysis of whole and fractionated cell extracts from synchronized T98G cells. Left and right panels show the subcellular distribution of RECQ1 (left column, top), RECQ4 (right column, top), and four additional replication proteins, together with an α-tubulin control (both columns), in whole-cell lysates (WCL) and in cytosolic (S2), soluble nuclear (S3), and chromatin-enriched (P3) fractions prepared from RECQ1-, RECQ4-, or control (luciferase)-depleted cells.
FIG. 9.
FIG. 9.
Depletion of human RECQ1 or RECQ4 affects DNA replication dynamics. (A) An outline of the experimental protocol is shown at the top, in which asynchronous cells were labeled consecutively with IdU (green) and then with CldU (red) for 40 min each prior to isolating and stretching DNA for immunostaining as described in Materials and Methods. Shown below this are representative images of replication tracks in control (luciferase)-, RECQ1-, and RECQ4-depleted cells. All track photos are shown at identical magnifications, where the white scale bar (lower right) is 10 μm long, representing approximately 39 kb of DNA. (B) RECQ1 or RECQ4 depletion reduces the probability of origin firing in stretched DNA samples. Origin firing events among all tracks labeled during the protocol for panel A were identified as CldU-only (red only) or CldU-IdU-CldU (red-green-red) triple-segment tracks (see diagram at top). The mean percentages of new origin firing events defined by these two track types among all labeled tracks are shown for three independent experiments in which 200 to 450 tracks/experiment were typed for control-, RECQ1-, or RECQ4-depleted cells. Error bars show standard deviations. The P values, calculated using Student's t test, are 0.074 between luciferase and RECQ1 and 0.021 between luciferase and RECQ4. (C) RECQ1 depletion, but not RECQ4 depletion, slows ongoing replication forks. The bar graph summarizes mean lengths of first-label IdU (green) segments labeled for 40 min in two-segment (green-red) tracks to ensure that fork rate measurements were made from active replication forks (see the diagram in panel A). Track lengths were measured in μm, using AxioVision software (Carl Zeiss), for three independent experiments in which 150 to 370 first-segment track lengths were measured for each sample. Error bars show 95% confidence intervals for sample means. The statistical significance of differences in mean track lengths was determined by a two-sample Kolmogorov-Smirnov test. A representative P value is shown for a control (luciferase)- versus RECQ1-depleted sample pair.
FIG. 10.
FIG. 10.
Model of cell cycle-dependent loading of RECQ1 and RECQ4 proteins onto DNA replication origins. RECQ4 is recruited to origins in late G1 as part of pre-RC assembly. At the G1/S transition, CDC6 release signals preinitiation complex (pre-IC) formation. RECQ1, as well as additional RECQ4, is recruited in early S phase, after the release of ORC1. Both RECQ1 and RECQ4 are no longer detected on the lamin B2 origin by mid-S phase, when either or both may be associated with active replisomes. This cell cycle phase-dependent loading and the subsequent loss of RECQ1 and RECQ4 for origins of replication suggest specific roles for each protein in replication initiation and, potentially, other specific aspects of DNA replication, such as fork progression (see text for additional discussion).

Similar articles

Cited by

References

    1. Abdurashidova, G., M. B. Danailov, A. Ochem, G. Triolo, V. Djeliova, S. Radulescu, A. Vindigni, S. Riva, and A. Falaschi. 2003. Localization of proteins bound to a replication origin of human DNA along the cell cycle. EMBO J. 22:4294-4303. - PMC - PubMed
    1. Abdurashidova, G., M. Deganuto, R. Klima, S. Riva, G. Biamonti, M. Giacca, and A. Falaschi. 2000. Start sites of bidirectional DNA synthesis at the human lamin B2 origin. Science 287:2023-2026. - PubMed
    1. Bachrati, C. Z., and I. D. Hickson. 2008. RecQ helicases: guardian angels of the DNA replication fork. Chromosoma 117:219-233. - PubMed
    1. Bateman, J. R., and C. T. Wu. 2007. DNA replication and models for the origin of piRNAs. Bioessays 29:382-385. - PubMed
    1. Bischof, O., S. H. Kim, J. Irving, S. Beresten, N. A. Ellis, and J. Campisi. 2001. Regulation and localization of the Bloom syndrome protein in response to DNA damage. J. Cell Biol. 153:367-380. - PMC - PubMed

Publication types

LinkOut - more resources