. 2010 Mar;30(6):1357-67.
doi: 10.1128/MCB.01149-09. Epub 2010 Jan 11.

Mitochondrial DNA toxicity in forebrain neurons causes apoptosis, neurodegeneration, and impaired behavior

Affiliations

Mitochondrial DNA toxicity in forebrain neurons causes apoptosis, neurodegeneration, and impaired behavior

Knut H Lauritzen et al. Mol Cell Biol. 2010 Mar.

Abstract

Mitochondrial dysfunction underlying changes in neurodegenerative diseases is often associated with apoptosis and a progressive loss of neurons, and damage to the mitochondrial genome is proposed to be involved in such pathologies. In the present study we designed a mouse model that allows us to specifically induce mitochondrial DNA toxicity in the forebrain neurons of adult mice. This is achieved by CaMKIIalpha-regulated inducible expression of a mutated version of the mitochondrial UNG DNA repair enzyme (mutUNG1). This enzyme is capable of removing thymine from the mitochondrial genome. We demonstrate that a continual generation of apyrimidinic sites causes apoptosis and neuronal death. These defects are associated with behavioral alterations characterized by increased locomotor activity, impaired cognitive abilities, and lack of anxietylike responses. In summary, whereas mitochondrial base substitution and deletions previously have been shown to correlate with premature and natural aging, respectively, we show that a high level of apyrimidinic sites lead to mitochondrial DNA cytotoxicity, which causes apoptosis, followed by neurodegeneration.


Figures
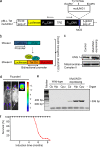
FIG. 1.
FIG. 1.
Verification of the CaMKIIα-inducible mutUNG1 mouse model. (a) Construct design for the generation of mutUNG1 inducible mice. (b) Working model of the transgenic mouse. (c) Western analysis showing increased expression of UNG1 in stable transfected cells. Antibodies against mitochondrial complex II were used as a loading control. (d) Luciferase activity measured with a charge-coupled device camera in transgenic founder mouse. Bioluminescence is expressed as photons/s cm2 steradian. (e) Expression of mutUNG1-transgene analyzed by using reverse transcriptase PCR visualized on an agarose gel. Cb, cerebellum; Hip, hippocampus; Cpu, caudate putamen. (f) Survival of wild-type (black) and mutUNG1-expressing mice (red).
FIG. 2.
FIG. 2.
Activity and consequence of mutUNG1expression in transgenic mice. (a) Uracil and thymine removal activity was measured using a 5′-end radioactively labeled 31-mer oligonucleotide containing either a single uracil or a single thymine residue placed at position 16 from the 5′ terminus of the substrate and hybridized to a complementary strand. After incubation with tissue extracts, enzymatic activities were analyzed from the amount of incised thymine or uracil residues after cleavage of the resulting intermediate AP site with NaOH and heat and strand separation by denaturating PAGE. Bands were visualized and quantified by using a Typhoon 9410 and ImageQuant TL v2003.02 software (Amersham/GE Healthcare). (b) Uracil removal activity is highest in induced brain areas in mutUNG1 mice. (c) Thymine removal activity is only present in induced brain areas in mutUNG1 mice. *, no activity was identified. (d) Oxygraph measurements indicating reduced mitochondrial respiration capacity in complex I in the hippocampus of mutUNG1-expressing mice compared to wild-type littermates. (e) Oxygraph measurements indicating reduced mitochondrial respiration capacity in complex II in the hippocampus of mutUNG1 expressing mice compared to wild-type littermates. Cb, cerebellum; Hip, hippocampus; Cpu, caudate putamen.
FIG. 3.
FIG. 3.
AP site appearances in mutUNG1-expressing mice. (a) Coronal cryosections of the hippocampus and cerebellum probed with an aldehyde-reactive probe and stained with DAPI demonstrate a high level of AP sites, but only in the hippocampus of induced mutUNG1 mice. Scale bar, 100 μm. (b) AP sites are only seen in parts of the hippocampus containing mitochondria, not nuclei, as demonstrated here in a mutUNG1 mouse induced for 3 months. Scale bar, 25 μm.
FIG. 4.
FIG. 4.
Induced mutUNG1 mice show progressive atrophy, neuronal loss, and apoptosis in the hippocampus. (a) HE-stained coronal paraffin sections of hippocampus of wild-type and mutUNG1-expressing mice at different time points of induction show progressive atrophy in induced mutUNG1 mice. (b) Immunostained coronal cryosections of hippocampus and caudate putamen incubated with antibodies against neuronal marker MAP2 and astrocyte marker GFAP in addition to DAPI stain reveal neuronal loss in hippocampus of induced mutUNG1 mice. (c) TUNEL (and DAPI) staining of cryosections of wild-type and mutUNG1-expressing mice at different time points of induction reveal a high degree of apoptosis in the hippocampus, but not in caudate putamen, in induced mutUNG1 mice. Scale bars, 100 μm.
FIG. 5.
FIG. 5.
Neurodegeneration and reduced membrane length of the postsynaptic density on dendritic spines from mutUNG1-expressing CA1 pyramidal cells. Electron micrographs showing examples of terminals making asymmetric (i.e., excitatory) synapses with dendritic spines in wild-type and mutUNG1-expressing mice in CA1 stratum radiatum of hippocampus (a) and in the cerebellar molecular layer (b). Note the small size of the tissue profiles, including a short length of the PSD (arrowheads), in the mutUNG1-expressing hippocampus. The following structures are indicated: axon terminal (terminal), postsynaptic spine (spine), ends of PSD (arrowheads), mitochondria (m), parallel fiber-Purkinje cell synapses (Pft), and stem dendrite. Scale bars, 150 nm. (c) Histograms showing the mean PSD length ± the standard deviation of excitatory synapses in and four mutUNG1-expressing mice and four wild-type littermates in CA1 stratum radiatum of hippocampus (c) and the cerebellar molecular layer (d). *, the PSD values in all hippocampal mutUNG1-expressing mice were significantly lower than those in wild-type littermates (P < 0.02).
FIG. 6.
FIG. 6.
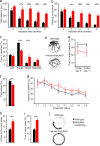
Increased locomotor activity, but decreased cognitive ability and anxietylike behavior, in mutUNG1-expressing mice. (a) Mice expressing mutUNG1 show higher locomotor activity in the form of total distance traveled in open field tests compared to wild-type littermates. (b) MutUNG1-expressing mice show higher activity in the form of rearing movements in open field tests compared to wild-type littermates. (c) Percentage of time spent in each of the four quadrants of the water maze during probe trials. The mutUNG1 mice spend less time in the target quadrant than the wild-type littermates. The results from both probe trials have been pooled. (d) Representative swimming paths in the water maze during the probe trial on day 5. (e) Percentage of time spent in the target quadrant of the water maze for both probe trials. (f) Percentage of time in thigmotaxis (that is, the tendency of rodents to hug the wall) during the water maze test. (g) Latency to locate platform position during the learning phase of the water maze task. (h) Entries to the open areas of the elevated zero maze. Induced mutUNG1 mice show reduced anxiety responses by a higher entry frequency into the open areas. (i) Percentage of time in the open areas of the elevated zero maze. Induced mutUNG1 mice show reduced anxiety responses by spending more time in the open areas. (j) Representative paths of the head during the elevated zero maze task. Closed quadrants are marked with double lines.

Similar articles

Cited by

References

    1. Anderson, C. T., and E. C. Friedberg. 1980. The presence of nuclear and mitochondrial uracil-DNA glycosylase in extracts of human KB cells. Nucleic Acids Res. 8:875-888. - PMC - PubMed
    1. Anderson, M. F., and N. R. Sims. 2000. Improved recovery of highly enriched mitochondrial fractions from small brain tissue samples. Brain Res. Brain Res. Protoc. 5:95-101. - PubMed
    1. Avkin, S., S. Adar, G. Blander, and Z. Livneh. 2002. Quantitative measurement of translesion replication in human cells: evidence for bypass of abasic sites by a replicative DNA polymerase. Proc. Natl. Acad. Sci. U. S. A. 99:3764-3769. - PMC - PubMed
    1. Baron, U., S. Freundlieb, M. Gossen, and H. Bujard. 1995. Coregulation of two gene activities by tetracycline via a bidirectional promoter. Nucleic Acids Res. 23:3605-3606. - PMC - PubMed
    1. Baumgartel, K., D. Genoux, H. Welzl, R. Y. Tweedie-Cullen, K. Koshibu, M. Livingstone-Zatchej, C. Mamie, and I. M. Mansuy. 2008. Control of the establishment of aversive memory by calcineurin and Zif268. Nat. Neurosci. 11:572-578. - PubMed

Publication types

MeSH terms

Substances

LinkOut - more resources