. 2010 Jan 18;207(1):51-9.
doi: 10.1084/jem.20092060. Epub 2010 Jan 11.

CD8 T cell response and evolutionary pressure to HIV-1 cryptic epitopes derived from antisense transcription

Affiliations

CD8 T cell response and evolutionary pressure to HIV-1 cryptic epitopes derived from antisense transcription

Anju Bansal et al. J Exp Med. .

Abstract

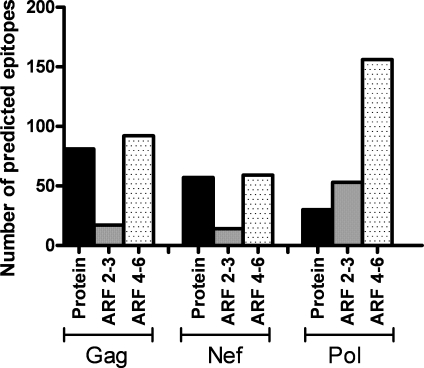
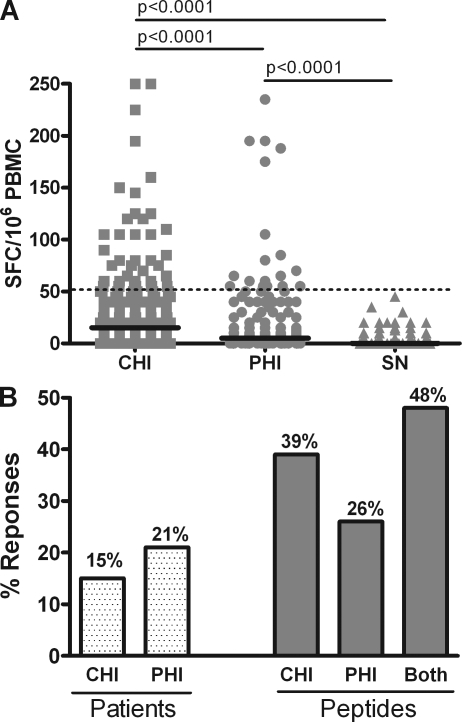
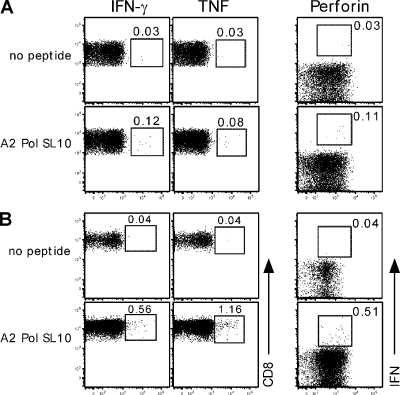
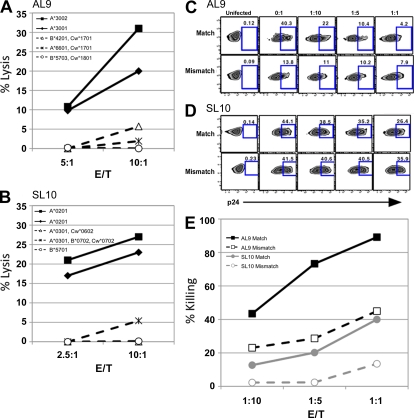
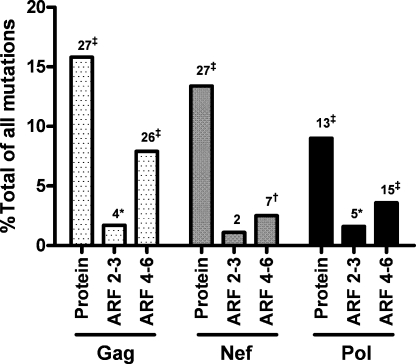
Retroviruses pack multiple genes into relatively small genomes by encoding several genes in the same genomic region with overlapping reading frames. Both sense and antisense HIV-1 transcripts contain open reading frames for known functional proteins as well as numerous alternative reading frames (ARFs). At least some ARFs have the potential to encode proteins of unknown function, and their antigenic properties can be considered as cryptic epitopes (CEs). To examine the extent of active immune response to virally encoded CEs, we analyzed human leukocyte antigen class I-associated polymorphisms in HIV-1 gag, pol, and nef genes from a large cohort of South Africans with chronic infection. In all, 391 CEs and 168 conventional epitopes were predicted, with the majority (307; 79%) of CEs derived from antisense transcripts. In further evaluation of CD8 T cell responses to a subset of the predicted CEs in patients with primary or chronic infection, both sense- and antisense-encoded CEs were immunogenic at both stages of infection. In addition, CEs often mutated during the first year of infection, which was consistent with immune selection for escape variants. These findings indicate that the HIV-1 genome might encode and deploy a large potential repertoire of unconventional epitopes to enhance vaccine-induced antiviral immunity.


Figures

Figure 1.
Figure 1.
Predicting CE-specific CD8 T cells using HLA-I–associated HIV-1 polymorphisms. HLA-I–associated HIV-1 polymorphisms in gag, nef, and pol were used to predict potential CD8 T cell epitopes in all reading frames. The number of predicted epitopes is compared between protein (sense RF 1) and the ARFs (the other five reading frames). The ARFs include sense ARFs 2 and 3 as well as antisense ARFs 4–6.
Figure 2.
Figure 2.
CE-specific responses are recognized by CD8 T cells in HIV-1 infection. (A) An IFN-γ ELISPOT assay using antigen-specific stimulation in duplicate was used to determine the magnitude of T cell responses in primary (PHI; n = 24) and chronic (CHI; n = 41) HIV-1 subtype B–infected patients. These responses were compared with SN controls (n = 15). Each symbol represents the response magnitude to an individual CE. The dotted line indicates the cutoff for a positive response (>55 SFCs/106 PBMCs), and horizontal bars represent medians. (B) The percentage of patients or peptides that elicited a CE-specific response are shown. The percent positive is shown on top of the bar.
Figure 3.
Figure 3.
CE-specific CD8 T cells produce cytokines and effector molecules. (A and B) PBMCs were stained for phenotype and functionally characterizing CE-specific T cell responses. The production of cytokines (IFN-γ, IL-2, and TNF) and up-regulation of CD107 and perforin by antigen-specific CD8 T cells were measured (percentages are shown). Representative data from a chronically infected patient showing CE-specific responses as measured ex vivo (A) and after a 10-d culture (B) are shown.
Figure 4.
Figure 4.
CE-specific T cells recognize peptide-pulsed and HIV-1–infected targets. (A and B) T cell lines were derived by peptide-specific stimulation followed by limiting dilution cloning. MHC restriction of the T cell lines was determined using matched (continuous lines) and mismatched (dashed lines) HLA-I–expressing B cell lymphoblastic cell lines as targets in a 51Cr release assay for an A*3002-restricted AL9-specific T cell line (A) and an A*0205-restricted SL10-specific T cell line (B). The HLA-Is of the patient from whom the T cell line was derived are A*3001/A*6601, B*4201/B*5703, and Cw*1701/Cw*1801 (A), and A*0201/A*0301, B*0702/B*5701, and Cw*0602/Cw*0702 (B). The HLA-Is of B cell lymphoblastic cell lines that are shared with the patient are shown inside the panel. Results are representative of three independent experiments. (C–E) CD8 T cell–depleted PBMCs from HLA-1–matched or –mismatched donors were activated with PHA for 2 d and infected with HIV-1 NL4.3 at an MOI of 0.1 for 2 d. The infected targets were co-cultured with effectors, i.e., a CE-specific line (A*3002-AL9 [C] or A*0205-SL10 [D]), at 1:10, 1:5, and 1:1 E/T ratios for 24 h. The killing of infected targets was measured by p24 reduction in an ICS assay. (C and D) Density plots showing the percentage of p24 staining of target cells after co-culture with the effector line. (E) The percentage killing of HLA-I–matched versus –mismatched targets by the A*3002–AL9 and A*0205-SL10 cell lines are shown graphically.
Figure 5.
Figure 5.
Evolution of predicted CEs after primary HIV-1 infection. Sequencing of gag, nef, and pol was performed in 37 epidemiologically linked recipients from Zambia at the time of identified infection and every 3 mo for the first year. The number of observed mutations during this time that matched the predicted HLA-I–associated HIV-1 polymorphisms in the chronic cohort (Fig. 1) as a percentage of the total observed mutations (those not predicted in the chronic cohort) is shown. The total number of predicted mutations is shown above each bar. Symbols next to the number of predicted mutations designate the reading frames where mutations, predicted from the chronic cohort, were not caused by chance alone (*, P < 0.04; †, P < 0.01; ‡, P < 0.0001).

Similar articles

Cited by

References

    1. Altfeld M., Rosenberg E.S., Shankarappa R., Mukherjee J.S., Hecht F.M., Eldridge R.L., Addo M.M., Poon S.H., Phillips M.N., Robbins G.K., et al. 2001. Cellular immune responses and viral diversity in individuals treated during acute and early HIV-1 infection. J. Exp. Med. 193:169–180 10.1084/jem.193.2.169 - DOI - PMC - PubMed
    1. Bansal A., Yue L., Conway J., Yusim K., Tang J., Kappes J., Kaslow R.A., Wilson C.M., Goepfert P.A. 2007. Immunological control of chronic HIV-1 infection: HLA-mediated immune function and viral evolution in adolescents. AIDS. 21:2387–2397 10.1097/QAD.0b013e3282f13823 - DOI - PMC - PubMed
    1. Bansal A., Jackson B., West K., Wang S., Lu S., Kennedy J.S., Goepfert P.A. 2008. Multifunctional T-cell characteristics induced by a polyvalent DNA prime/protein boost human immunodeficiency virus type 1 vaccine regimen given to healthy adults are dependent on the route and dose of administration. J. Virol. 82:6458–6469 10.1128/JVI.00068-08 - DOI - PMC - PubMed
    1. Betts M.R., Ambrozak D.R., Douek D.C., Bonhoeffer S., Brenchley J.M., Casazza J.P., Koup R.A., Picker L.J. 2001. Analysis of total human immunodeficiency virus (HIV)-specific CD4(+) and CD8(+) T-cell responses: relationship to viral load in untreated HIV infection. J. Virol. 75:11983–11991 10.1128/JVI.75.24.11983-11991.2001 - DOI - PMC - PubMed
    1. Bruce A.G., Atkins J.F., Gesteland R.F. 1986. tRNA anticodon replacement experiments show that ribosomal frameshifting can be caused by doublet decoding. Proc. Natl. Acad. Sci. USA. 83:5062–5066 10.1073/pnas.83.14.5062 - DOI - PMC - PubMed

Publication types

MeSH terms

Substances