. 2010 Jan 18;207(1):223-35.
doi: 10.1084/jem.20091279. Epub 2010 Jan 11.

CD8+ T cell concentration determines their efficiency in killing cognate antigen-expressing syngeneic mammalian cells in vitro and in mouse tissues

Affiliations

CD8+ T cell concentration determines their efficiency in killing cognate antigen-expressing syngeneic mammalian cells in vitro and in mouse tissues

Sadna Budhu et al. J Exp Med. .

Abstract

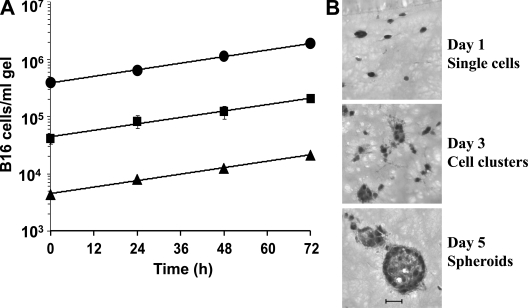
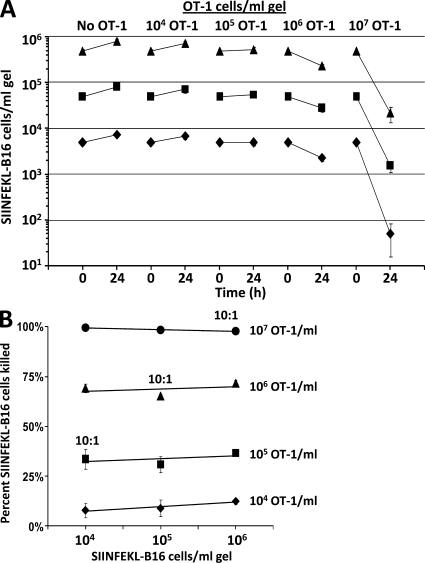
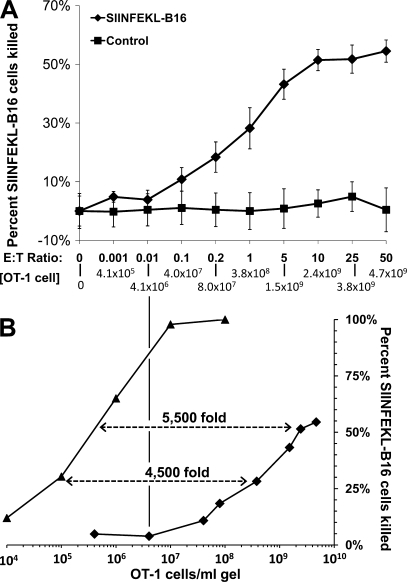
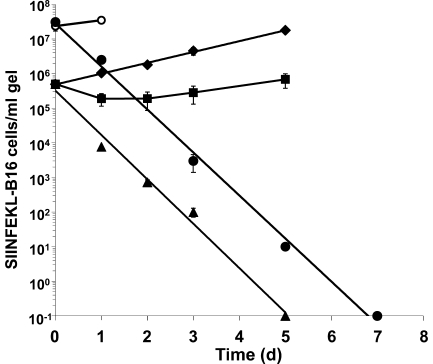
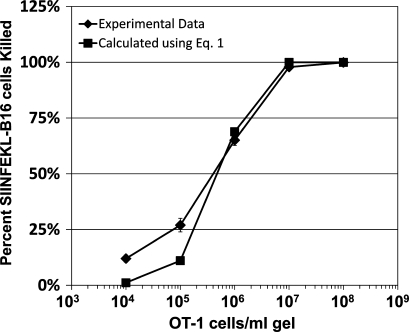
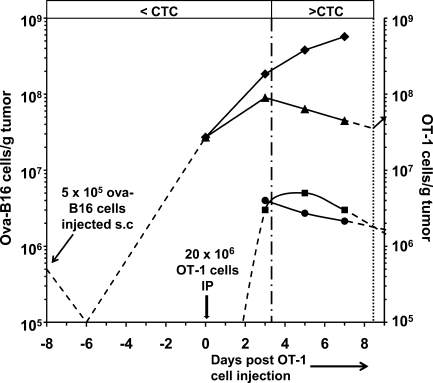
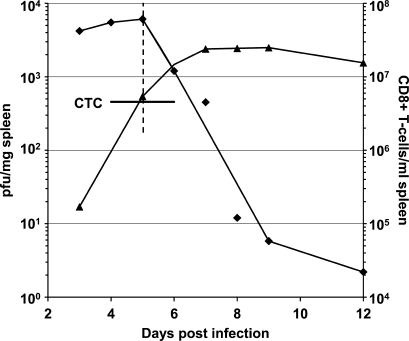
We describe a quantitative model for assessing the cytolytic activity of antigen-specific CD8+ T cells in vitro and in vivo in which the concentration of antigen-specific CD8+ T cells determines the efficiency with which these cells kill cognate antigen-expressing melanoma cells in packed cell pellets, in three-dimensional collagen-fibrin gels in vitro, and in established melanomas in vivo. In combination with a clonogenic assay for melanoma cells, collagen-fibrin gels are 4,500-5,500-fold more sensitive than the packed cell pellet-type assays generally used to measure CD8+ T cell cytolytic activity. An equation previously used to describe neutrophil bactericidal activity in vitro and in vivo also describes antigen-specific CD8+ T cell-mediated cytolysis of cognate antigen-expressing melanoma cells in collagen-fibrin gels in vitro and in transplanted tumors in vivo. We have used this equation to calculate the critical concentration of antigen-specific CD8+ T cells, which is the concentration of these cells required to hold constant the concentration of a growing population of cognate antigen-expressing melanoma cells. It is approximately 3.5x10(5)/ml collagen-fibrin gel in vitro and approximately 3x10(6)/ml or /g melanoma for previously published studies of ex vivo-activated adoptively transferred tumor antigen-specific CD8+ T cell killing of cognate antigen-expressing melanoma cells in established tumors in vivo. The antigen-specific CD8+ T cell concentration required to kill 100% of 2x10(7)/ml cognate antigen-expressing melanoma cells in collagen fibrin gels is >or=10(7)/ml of gel.


Figures

Figure 1.
Figure 1.
Growth of B16 mouse melanoma cells in collagen-fibrin gels. (A) Collagen-fibrin gels containing 5 × 10⁴ (▴), 5 × 10⁵ (■), or 5 × 10⁶ (•) B16 cells/ml and RPMI 1640 with 10% FBS and 5 × 10⁻⁵ M β-ME were incubated at 37°C for 3 d. Gels were harvested daily and their content of clonogenic B16 cells was assessed as described in Materials and methods. Data shown represent mean ± SEM of n = 3 experiments performed in duplicate. (B) Hematoxylin/eosin-stained frozen sections of B16 cells grown at 37°C in collagen-fibrin gels for 1, 3, and 5 d. Bar, 50 µm.
Figure 2.
Figure 2.
OT-1 cell concentration determines the efficiency of killing of SIINFEKL-B16 cells growing in collagen-fibrin gels. (A) Collagen-fibrin gels containing 5 × 10⁴ (♦), 5 × 10⁵ (■), or 5 × 10⁶ (▴) SIINFEKL-B16 cells/ml of gel, with or without 104, 105, 106, or 107 OT-1 cells/ml of gel, were overlaid with 0.5 ml RPMI 1640 with 10% FBS and 5 × 10⁻⁵ M β-ME and incubated at 37°C. Shown is the number of clonogenic B16 cells recovered from gels at time 0 and after a 24-h incubation at 37°C with the indicated concentration of OT-1 cells. Data shown represent mean ± SEM of n = 3 experiments performed in duplicate. (B) Relationship between OT-1 cell concentration, initial SIINFEKL-B16 cell concentration, and percentage of B16 cells killed.
Figure 3.
Figure 3.
CFSE-labeled OT-1 cells remain viable but do not divide when coincubated with SIINFEKL-B16 cells in collagen-fibrin gels. (A) 106 SIINFEKL-B16 cells/ml were coincubated with 107/ml CFSE-labeled OT-1 cells in collagen-fibrin gels in the presence or absence of 100 U/ml IL-2. Gels were lysed as described at 24, 48, and 72 h. The released cells were incubated in propidium iodide and analyzed by FACS. (B) CFSE-labeled naive OT-1 splenocytes were incubated with 0.75 µg/ml SIINFEKL peptide at 37°C for 72 h, after which the cells were isolated and analyzed by FACS. Shown is a representative experiment of n = 3 experiments performed in duplicate.
Figure 4.
Figure 4.
OT-1 cell concentration determines the efficiency of killing of SIINFEKL peptide–pulsed B16 cells in packed cell pellet–type assays. (A) 104 SIINFEKL-pulsed (♦) or nonpulsed (■) B16 cells were mixed with 10–5 × 10⁵ activated OT-1 cells in 200 µl OT-1 medium in round-bottom wells of a 96-well plate. Plates were centrifuged at 50 g for 5 min to pellet the cells and incubated at 37°C for 4 h. Cells in each well were dissociated with trypsin-EDTA, and their viability was measured by clonogenic assay. Data shown represent mean ± SEM of n = 3 experiments performed in duplicate. (B) Efficiency of OT-1 cell killing of SIINFEKL-B16 cells in collagen-fibrin gels (▴) versus packed pellet–type assays (♦). Data for collagen-fibrin gels were obtained from Table S1. Data for packed pellet–type assays were obtained from A.
Figure 5.
Figure 5.
OT-1 cells affect sterilizing immunity versus SIINFEKL-B16 cells in collagen-fibrin gels. Collagen-fibrin gels containing 5 × 10⁵ SIINFEKL-B16 cells/ml of gel alone (♦) or with 106 (■) or 107 (▴)/ml OT-1 cells were incubated at 37°C for up to 5 d. Gels were lysed on the day indicated and assayed for viable B16 cells as described in Materials and methods. Data shown represent mean ± SEM of n = 3 experiments performed in duplicate. Collagen-fibrin gels containing 2 × 10⁷ SIINFEKL-B16 cells/ml of gel in medium containing 20 U IL-2/ml of gel alone (○) or with 107 (•)/ml OT-1cells were incubated at 37°C for up to 7 d, lysed, and assayed for viable B16 cells as described in Materials and methods. Shown are the results of a representative experiment performed in duplicate.
Figure 6.
Figure 6.
Comparison of experimentally derived versus calculated values for OT-1 cell killing of SIINFEKL-B16 cells in collagen-fibrin gels. Experimental data ±SEM are from Fig. 2 and Table S1. Calculated values were determined using Eq. 1 (Li et al., 2004), and k = 8.1 × 10⁻¹⁰ ml/OT-1 cell/min. Pearson’s correlation between experimental and calculated values = 0.994 (P = 0.00048).
Figure 7.
Figure 7.
Relationship between ova-B16 tumor growth/regression and intratumoral OT-1 cell concentration in OT-1 cell–treated ova-B16 tumor–bearing mice. Data are obtained from Figs. 2 and 4 in Petersen et al. (2006) and were calculated as described in Table S4. C57BL/6 mice were inoculated with 5 × 10⁵ ova-B16 cells subcutaneously on day −8, and with 20 × 106 in vitro–activated OT-1 cells i.p. on day 0. Intratumoral concentration is shown of OT-1 cells (■) from Fig. 2 (Petersen et al., 2006). Also shown are the number of ova-B16 cells in tumors of control mice (♦) and in tumors of mice that received 20 × 106 in vitro–activated OT-1 cells on day 0 (▴) calculated from Fig. 4 of Petersen et al. (2006) as described in (Table S4). CTC (•) was calculated as described in Li et al. (2004) and in the Materials and methods (Table S4). Dashed lines represent extrapolated trends based on findings reported in Petersen et al. (2006) and Stephens and Peacock (1978). The vertical dashed-dotted line indicates the point in time at which the intratumoral OT-1 concentration exceeds the CTC. The vertical dotted line indicates the estimated point in time at which the intratumoral OT-1 concentration falls below the CTC, thereby permitting resumption of tumor growth (arrow).
Figure 8.
Figure 8.
Effect of polyoma antigen–specific CD8+ T cells on polyoma virus growth in splenocytes from mice inoculated subcutaneously on day 0 with 2 × 10⁶ PFU of virus. Data are obtained from Fig. 2 and Table I in Lukacher et al. (1999). Polyoma virus concentration (♦, PFU/mg of spleen). Intrasplenic concentration of polyoma antigen–specific CD8+ T cells/ml of spleen (▴) was calculated as reported in Table S5. k and CTC were calculated using Eqs. 1 and 2 (Li et al., 2004), respectively, as described in Table S5 and in Materials and methods.

References

    1. Agger R., Petersen M.S., Petersen C.C., Hansen S.B., Stødkilde-Jørgensen H., Skands U., Blankenstein T., Andersen T.E., Hulgaard E.F., Jørgensen J.T., et al. 2007. T cell homing to tumors detected by 3D-coordinated positron emission tomography and magnetic resonance imaging. J. Immunother. 30:29–39 10.1097/01.cji.0000211326.38149.7e - DOI - PubMed
    1. Baramova E.N., Coucke P., Leprince P., De Pauw-Gillet M.C., Bassleer R., Foidart J.M. 1994. Evaluation of matrix metalloproteinases and serine proteases activities in three B16 melanoma cell lines with distinct tumorigenic potential. Anticancer Res. 14:841–846 - PubMed
    1. Blattman J.N., Greenberg P.D. 2006. PD-1 blockade: rescue from a near-death experience. Nat. Immunol. 7:227–228 10.1038/ni0306-227 - DOI - PubMed
    1. Bronte V., Mocellin S. 2009. Suppressive influences in the immune response to cancer. J. Immunother. 32:1–11 10.1097/CJI.0b013e3181837276 - DOI - PubMed
    1. Brunner K.T., Mauel J., Cerottini J.C., Chapuis B. 1968. Quantitative assay of the lytic action of immune lymphoid cells on 51-Cr-labelled allogeneic target cells in vitro; inhibition by isoantibody and by drugs. Immunology. 14:181–196 - PMC - PubMed

Publication types

Substances