. 2010 Jan 11;188(1):145-56.
doi: 10.1083/jcb.200908082.

Quantitative analysis of the native presynaptic cytomatrix by cryoelectron tomography

Affiliations

Quantitative analysis of the native presynaptic cytomatrix by cryoelectron tomography

Rubén Fernández-Busnadiego et al. J Cell Biol. .

Abstract

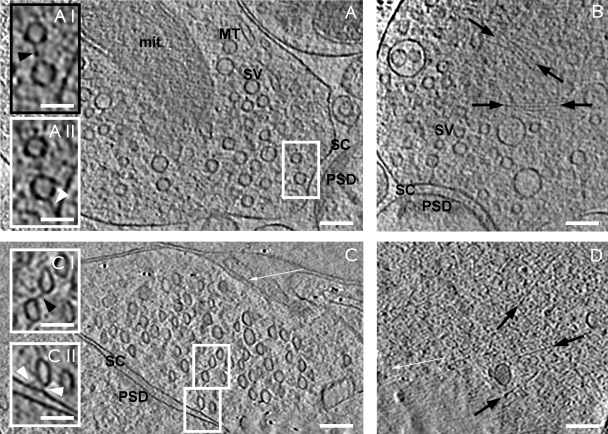
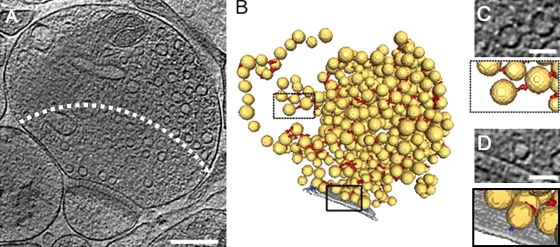
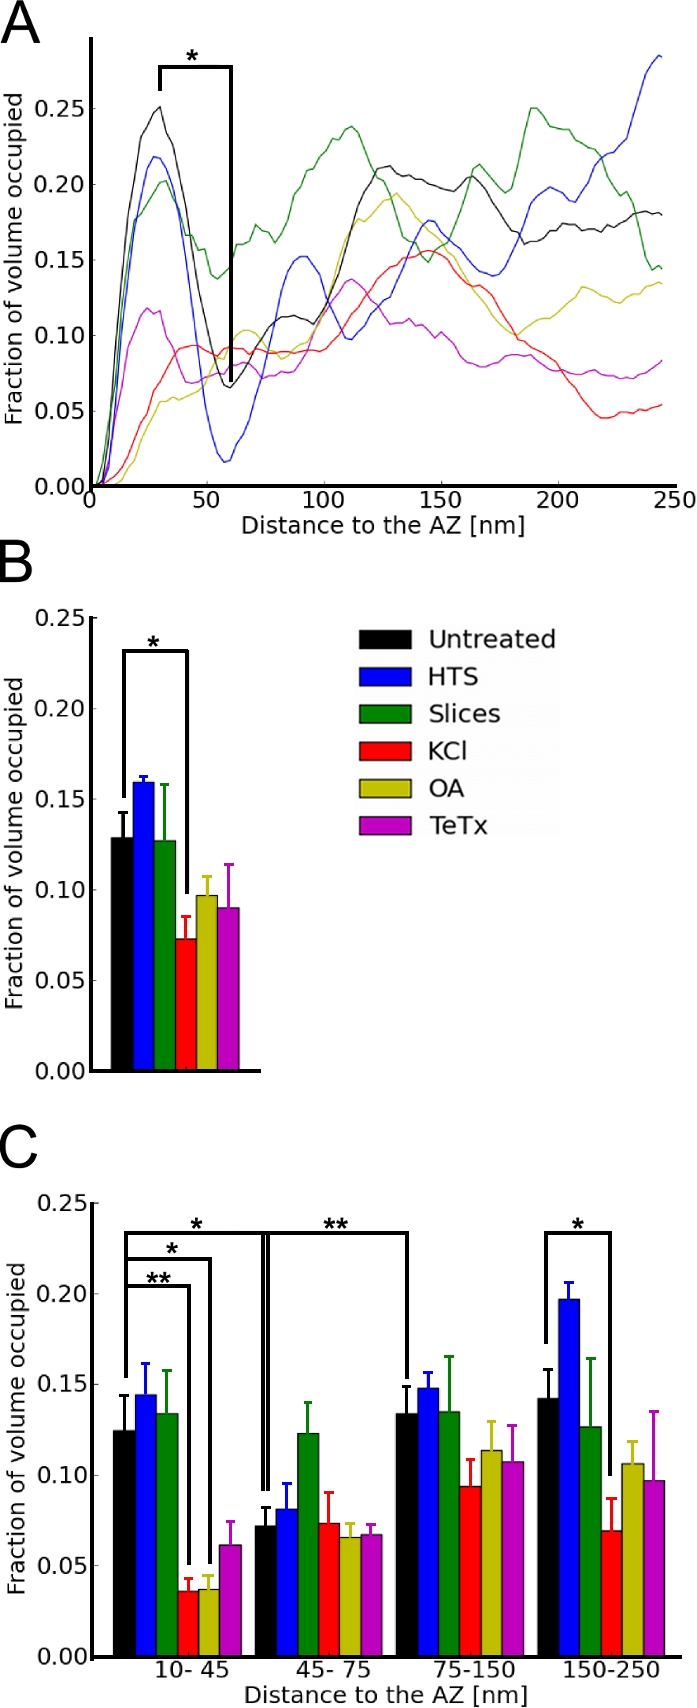
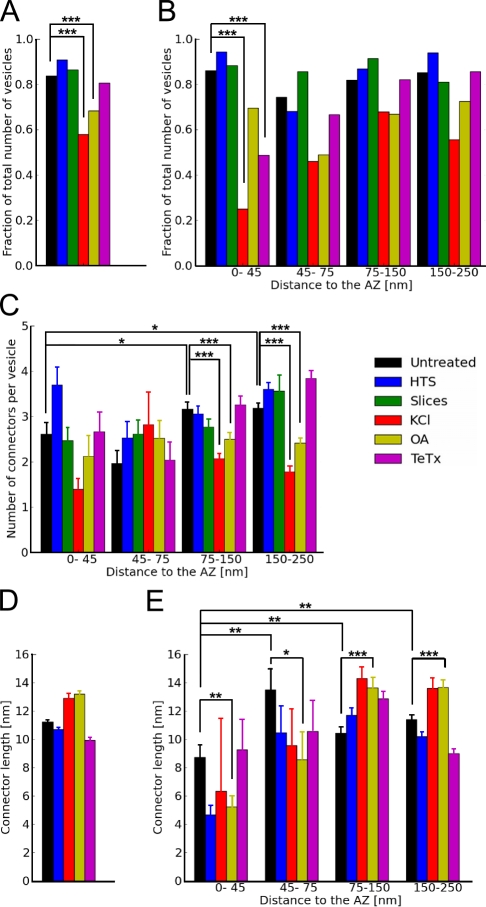
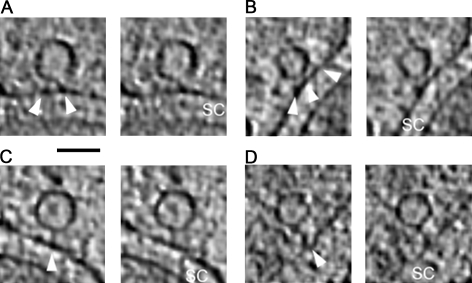
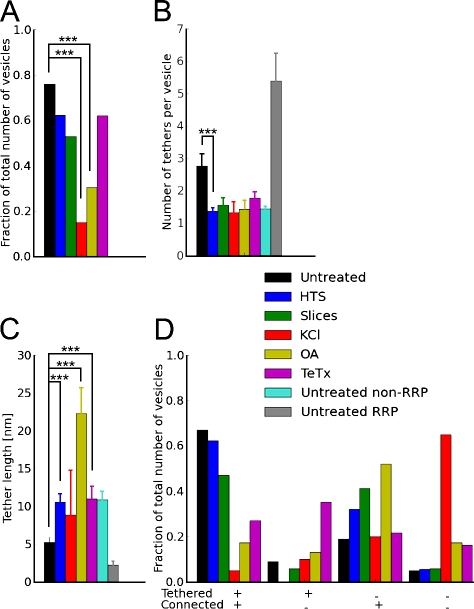
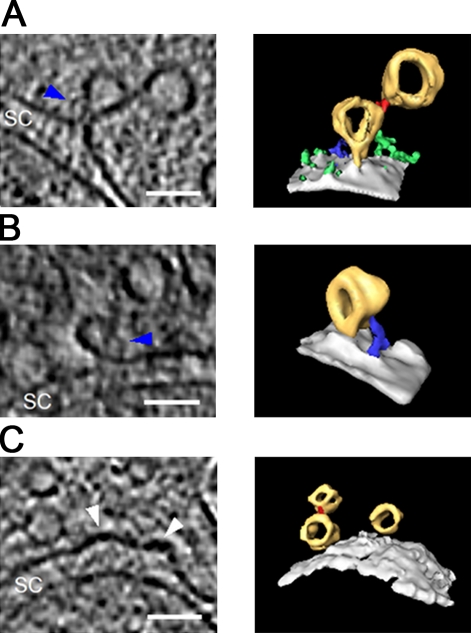
The presynaptic terminal contains a complex network of filaments whose precise organization and functions are not yet understood. The cryoelectron tomography experiments reported in this study indicate that these structures play a prominent role in synaptic vesicle release. Docked synaptic vesicles did not make membrane to membrane contact with the active zone but were instead linked to it by tethers of different length. Our observations are consistent with an exocytosis model in which vesicles are first anchored by long (>5 nm) tethers that give way to multiple short tethers once vesicles enter the readily releasable pool. The formation of short tethers was inhibited by tetanus toxin, indicating that it depends on soluble N-ethyl-maleimide sensitive fusion protein attachment protein receptor complex assembly. Vesicles were extensively interlinked via a set of connectors that underwent profound rearrangements upon synaptic stimulation and okadaic acid treatment, suggesting a role of these connectors in synaptic vesicle mobilization and neurotransmitter release.


Figures

Figure 1.
Figure 1.
Presynaptic morphology visualized in tomograms of frozen-hydrated synapses. (A) Untreated synaptosome. (A, I) Connector linking two vesicles (black arrowhead). (A, II) Tether linking a vesicle to the AZ (white arrowhead; same vesicles as in A [I] at another z slice). (B) OA-treated synaptosome showing presynaptic actin bundles (black arrows). (C) Organotypic slice. Synaptic vesicles are compressed along the cutting direction (white arrows in C and D). (C, I) Connector linking two vesicles (black arrowhead). (C, II) Tethers linking a vesicle to the AZ (white arrowheads). (D) Postsynaptic terminal showing actin filaments (black arrows). Tomographic slices are 2.7-nm thick. Insets show magnified views of boxed areas. SV, synaptic vesicle; mit, mitochondrion; MT, microtubule; SC, synaptic cleft; PSD, postsynaptic density. Bars: (main panels) 100 nm; (insets) 50 nm.
Figure 2.
Figure 2.
Segmentation procedure. (A) 2.7-nm-thick tomographic slice of a 100-mM HTS-treated synaptosome. The dashed line indicates the analyzed area (first 250 nm from the AZ). (B) 3D segmentation of synaptic vesicles (yellow), AZ (gray), synaptic vesicle connectors (red), and synaptic vesicle tethers (blue). Boxed regions are magnified in C and D. (C and D, top) Tomographic slices showing a synaptic vesicle connector (C) and a tether (D) and their 3D visualization as detected by the automated segmentation procedure (bottom). Bars: (A) 200 nm; (C and D) 50 nm.
Figure 3.
Figure 3.
Synaptic vesicle distribution within presynaptic terminals depicted as the fraction of cytoplasmic volume occupied by vesicles. (A) Representative traces of individual synapses. (B) Vesicle concentration for the first 250 nm from the AZ. (C) Vesicle concentration versus distance to the AZ. Plots show mean values and SEM (error bars). The confidence values are indicated by * and ** for P < 0.05 and P < 0.01, respectively. The number of presynaptic terminals analyzed for each treatment is shown in Table S1.
Figure 4.
Figure 4.
Synaptic vesicle connectors. (A) Fraction of connected vesicles for the first 250 nm from the AZ. (B) Fraction of connected vesicles versus distance to the AZ. (C) Number of connectors per connected vesicle versus distance to the AZ. (D) Connector length for the first 250 nm from the AZ. (E) Connector length versus distance to the AZ. Plots show mean values and SEM (error bars). The confidence values are indicated by *, **, and *** for P < 0.05, P < 0.01, and P < 0.001, respectively. The numbers of vesicles (A and B) and connectors (C–E) analyzed for each treatment are shown in Table S1.
Figure 5.
Figure 5.
Images of synaptic vesicle tethers. (A–D) Short (A and B; <5 nm) and long (C and D; >5 nm) synaptic vesicle tethers (white arrowheads) are shown. SC, synaptic cleft. Two consecutive 2.7-nm-thick tomographic slices are shown for each case. Bar, 50 nm.
Figure 6.
Figure 6.
Synaptic vesicle tethers. (A) Fraction of proximal synaptic vesicles tethered to the AZ. (B) Mean number of tethers per tethered synaptic vesicle. Untreated RRP and untreated non-RRP: tethered vesicles with more than two and up to two tethers in untreated synaptosomes, respectively. (C) Tether length for all tethered vesicles. (D) Fraction of proximal synaptic vesicles as a function of tethering and connectivity. Plots show mean values and SEM (error bars). The confidence values are indicated by *** for P < 0.001. The numbers of vesicles (A, B, and D) and tethers (C) analyzed for each treatment are shown in Table S1.
Figure 7.
Figure 7.
Direct membrane contact between synaptic vesicles and the AZ. (A–C, left) 2.7-nm-thick tomographic slices and the corresponding direct 3D rendering of the EM densities (right) are shown. (A) Synaptic vesicle with an open neck, which establishes continuity between the vesicular lumen and the extracellular space. An L-shaped density is visible close to the neck (blue arrowhead). (B) Synaptic vesicle making membrane contact with an invagination of the AZ. An L-shaped density is present close to the AZ invagination (blue arrowhead). (C) Regions of the AZ with high concave curvature (white arrowheads), which are likely signatures of full-collapse fusion events. Yellow, synaptic vesicles; red, synaptic vesicle connectors; gray, AZ; blue, synaptic vesicle–associated densities; green, other AZ densities. SC, synaptic cleft. Bars, 50 nm.

References

    1. Al-Amoudi A., Norlen L.P.O., Dubochet J. 2004. Cryo-electron microscopy of vitreous sections of native biological cells and tissues. J. Struct. Biol. 148:131–135 10.1016/j.jsb.2004.03.010 - DOI - PubMed
    1. Ashton A.C., Dolly J.O. 2000. A late phase of exocytosis from synaptosomes induced by elevated [Ca2+]i is not blocked by clostridial neurotoxins. J. Neurochem. 74:1979–1988 10.1046/j.1471-4159.2000.0741979.x - DOI - PubMed
    1. Ashton A.C., Ushkaryov Y.A. 2005. Properties of synaptic vesicle pools in mature central nerve terminals. J. Biol. Chem. 280:37278–37288 10.1074/jbc.M504137200 - DOI - PubMed
    1. Betz W.J., Henkel A.W. 1994. Okadaic acid disrupts clusters of synaptic vesicles in frog motor nerve terminals. J. Cell Biol. 124:843–854 10.1083/jcb.124.5.843 - DOI - PMC - PubMed
    1. Bourne J., Morgan J.R., Pieribone V.A. 2006. Actin polymerization regulates clathrin coat maturation during early stages of synaptic vesicle recycling at lamprey synapses. J. Comp. Neurol. 497:600–609 10.1002/cne.21006 - DOI - PubMed

Publication types