

The impact of microsomal prostaglandin e synthase 1 on blood pressure is determined by genetic background
- PMID: 20065147
- PMCID: PMC2836731
- DOI: 10.1161/HYPERTENSIONAHA.109.145631
The impact of microsomal prostaglandin e synthase 1 on blood pressure is determined by genetic background
Abstract
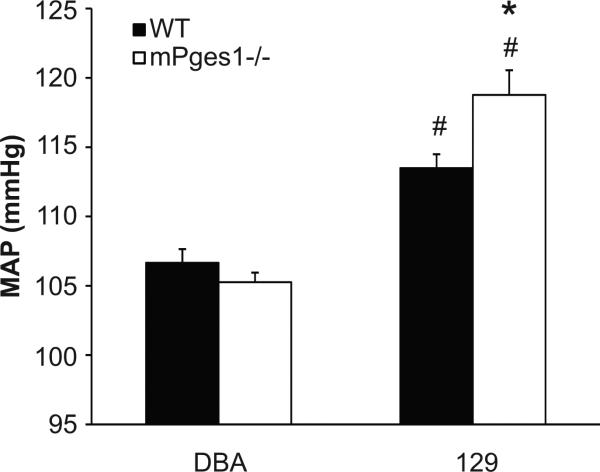
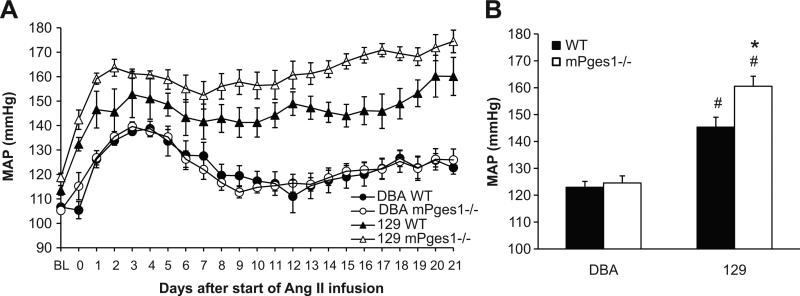
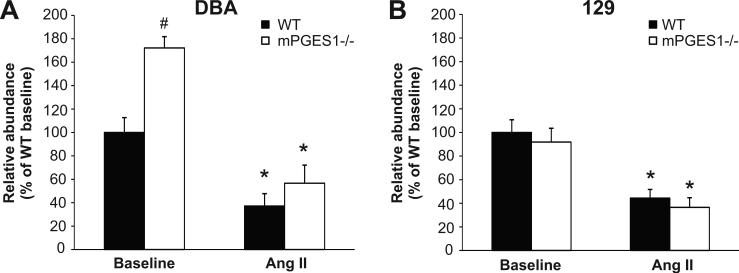
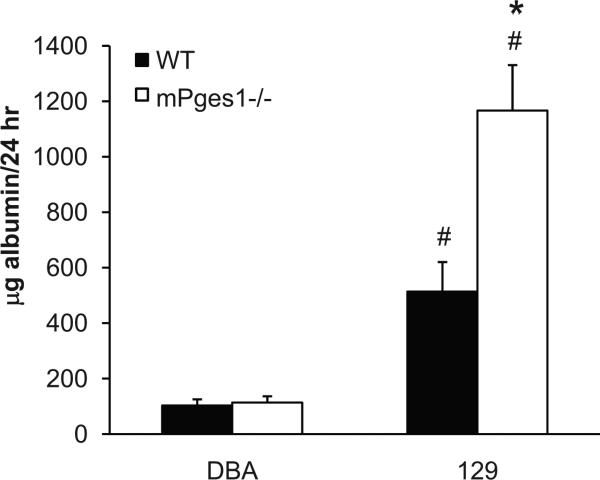
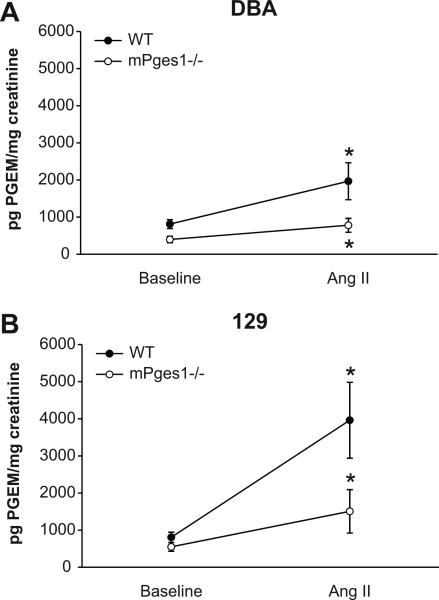
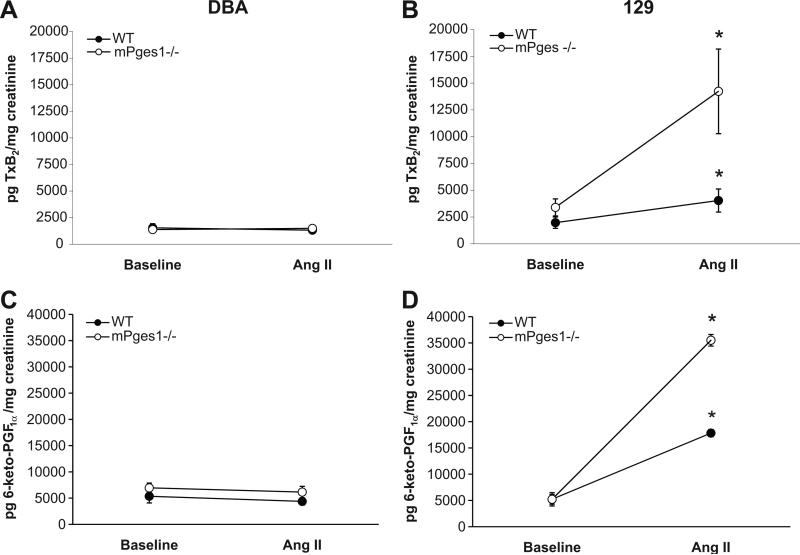
Prostaglandin (PG)E(2) has multiple actions that may affect blood pressure. It is synthesized from arachidonic acid by the sequential actions of phospholipases, cyclooxygenases, and PGE synthases. Although microsomal PGE synthase (mPGES)1 is the only genetically verified PGE synthase, results of previous studies examining the consequences of mPGES1 deficiency on blood pressure (BP) are conflicting. To determine whether genetic background modifies the impact of mPGES1 on BP, we generated mPGES1(-/-) mice on 2 distinct inbred backgrounds, DBA/1lacJ and 129/SvEv. On the DBA/1 background, baseline BP was similar between wild-type (WT) and mPGES1(-/-) mice. By contrast, on the 129 background, baseline BPs were significantly higher in mPGES1(-/-) animals than WT controls. During angiotensin II infusion, the DBA/1 mPGES1(-/-) and WT mice developed mild hypertension of similar magnitude, whereas 129-mPGES1(-/-) mice developed more severe hypertension than WT controls. DBA/1 animals developed only minimal albuminuria in response to angiotensin II infusion. By contrast, WT 129 mice had significantly higher levels of albumin excretion than WT DBA/1 and the extent of albuminuria was further augmented in 129 mPGES1(-/-) animals. In WT mice of both strains, the increase in urinary excretion of PGE(2) with angiotensin II was attenuated in mPGES1(-/-) animals. Urinary excretion of thromboxane was unaffected by angiotensin II in the DBA/1 lines but increased more than 4-fold in 129 mPGES1(-/-) mice. These data indicate that genetic background significantly modifies the BP response to mPGES1 deficiency. Exaggerated production of thromboxane may contribute to the robust hypertension and albuminuria in 129 mPGES1-deficient mice.
Figures
Similar articles
-
Role of microsomal prostaglandin E synthase 1 in the kidney.J Am Soc Nephrol. 2007 May;18(5):1466-75. doi: 10.1681/ASN.2006040343. Epub 2007 Apr 18. J Am Soc Nephrol. 2007. PMID: 17442791
-
Impaired inflammatory and pain responses in mice lacking an inducible prostaglandin E synthase.Proc Natl Acad Sci U S A. 2003 Jul 22;100(15):9044-9. doi: 10.1073/pnas.1332766100. Epub 2003 Jun 30. Proc Natl Acad Sci U S A. 2003. PMID: 12835414 Free PMC article.
-
Microsomal prostaglandin synthase-1-derived prostaglandin E2 protects against angiotensin II-induced hypertension via inhibition of oxidative stress.Hypertension. 2008 Nov;52(5):952-9. doi: 10.1161/HYPERTENSIONAHA.108.111229. Epub 2008 Sep 29. Hypertension. 2008. PMID: 18824665
-
Membrane prostaglandin E synthase-1: a novel therapeutic target.Pharmacol Rev. 2007 Sep;59(3):207-24. doi: 10.1124/pr.59.3.1. Pharmacol Rev. 2007. PMID: 17878511 Review.
-
Microsomal prostaglandin E synthase-1 and blood pressure regulation.Kidney Int. 2007 Aug;72(3):274-8. doi: 10.1038/sj.ki.5002326. Epub 2007 May 9. Kidney Int. 2007. PMID: 17495855 Review.
Cited by
-
2,5-Dimethylcelecoxib prevents pressure-induced left ventricular remodeling through GSK-3 activation.Hypertens Res. 2017 Feb;40(2):130-139. doi: 10.1038/hr.2016.122. Epub 2016 Sep 15. Hypertens Res. 2017. PMID: 27628899
-
Myeloid cell microsomal prostaglandin E synthase-1 fosters atherogenesis in mice.Proc Natl Acad Sci U S A. 2014 May 6;111(18):6828-33. doi: 10.1073/pnas.1401797111. Epub 2014 Apr 21. Proc Natl Acad Sci U S A. 2014. PMID: 24753592 Free PMC article.
-
Microsomal prostaglandin e synthase-1 in rheumatic diseases.Front Pharmacol. 2011 Jan 20;1:146. doi: 10.3389/fphar.2010.00146. eCollection 2010. Front Pharmacol. 2011. PMID: 21927605 Free PMC article.
-
Skin tight: macrophage-specific COX-2 induction links salt handling in kidney and skin.J Clin Invest. 2015 Nov 2;125(11):4008-10. doi: 10.1172/JCI84753. Epub 2015 Oct 20. J Clin Invest. 2015. PMID: 26495835 Free PMC article.
-
Epigenetic control of microsomal prostaglandin E synthase-1 by HDAC-mediated recruitment of p300.J Lipid Res. 2017 Feb;58(2):386-392. doi: 10.1194/jlr.M072280. Epub 2016 Dec 2. J Lipid Res. 2017. PMID: 27913583 Free PMC article.
References
-
- Stenson WF. Prostaglandins and epithelial response to injury. Curr Opin Gastroenterol. 2007;23:107–110. - PubMed
-
- Blatteis CM, Li S, Li Z, Feleder C, Perlik V. Cytokines, PGE2 and endotoxic fever: a reassessment. Prostaglandins Other Lipid Mediat. 2005;76:1–18. - PubMed
-
- Harris SG, Padilla J, Koumas L, Ray D, Phipps RP. Prostaglandins as modulators of immunity. Trends Immunol. 2002;23:144–150. - PubMed
-
- Hao CM, Breyer MD. Physiological regulation of prostaglandins in the kidney. Annu Rev Physiol. 2008;70:357–377. - PubMed
-
- Purdy KE, Arendshorst WJ. EP(1) and EP(4) receptors mediate prostaglandin E(2) actions in the microcirculation of rat kidney. Am J Physiol Renal Physiol. 2000;279:F755–764. - PubMed
Publication types
MeSH terms
Substances
Grants and funding
LinkOut - more resources
Full Text Sources
Other Literature Sources
Medical
Molecular Biology Databases
