. 2010 Jan;128(1):46-56.
doi: 10.1001/archophthalmol.2009.368.

Fundus autofluorescence imaging of the white dot syndromes

Affiliations

Fundus autofluorescence imaging of the white dot syndromes

Steven Yeh et al. Arch Ophthalmol. 2010 Jan.

Abstract

Objective: To characterize the fundus autofluorescence (FAF) findings in patients with white dot syndromes (WDSs).

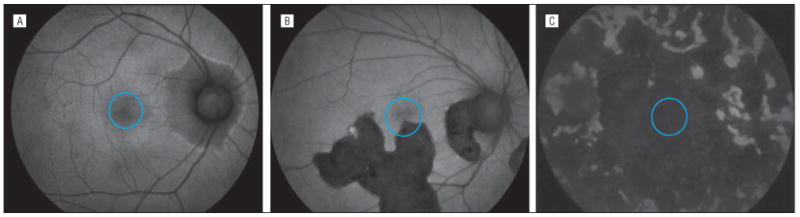
Methods: Patients with WDSs underwent ophthalmic examination, fundus photography, fluorescein angiography, and FAF imaging. Patients were categorized as having no, minimal, or predominant foveal hypoautofluorescence. The severity of visual impairment was then correlated with the degree of foveal hypoautofluorescence.

Results: Fifty-five eyes of 28 patients with WDSs were evaluated. Visual acuities ranged from 20/12.5 to hand motions. Diagnoses included serpiginous choroidopathy (5 patients), birdshot retinochoroidopathy (10), multifocal choroiditis (8), relentless placoid chorioretinitis (1), presumed tuberculosis-associated serpiginouslike choroidopathy (1), acute posterior multifocal placoid pigment epitheliopathy (1), and acute zonal occult outer retinopathy (2). In active serpiginous choroidopathy, notable hyperautofluorescence in active disease distinguished it from the variegated FAF features of tuberculosis-associated serpiginouslike choroidopathy. The percentage of patients with visual acuity impairment of less than 20/40 differed among eyes with no, minimal, and predominant foveal hypoautofluorescence (P < .001). Patients with predominant foveal hypoautofluorescence demonstrated worse visual acuity than those with minimal or no foveal hypoautofluorescence (both P < .001).

Conclusions: Fundus autofluorescence imaging is useful in the evaluation of the WDS. Visual acuity impairment is correlated with foveal hypoautofluorescence. Further studies are needed to evaluate the precise role of FAF imaging in the WDSs.


Figures

Figure 1
Figure 1
Grading scheme for foveal hypoautofluorescence. The majority of patients demonstrated hypoautofluorescence (ie, minimal, <50% or predominant, ≥50%) within their foveae. Patients were thus classified as having no pathologic foveal hypoautofluorescence (none) (A), minimal (ie, <50%) (B), or predominant (ie, ≥50%) (C) foveal hypoautofluorescence based on a 1–disc diameter circle (approximately 1500 μm) centered on the fovea.
Figure 2
Figure 2
Proportions of patients with moderate or severe visual impairment. A, After χ2 analysis, differences are apparent between the groups in which the degree of foveal hypoautofluorescence is none, minimal, or predominant. B, Kruskal-Wallis analysis shows that the mean logMAR visual acuity was significantly lower in patients with predominant foveal hypoautofluorescence compared with patients with minimal or no foveal hypoautofluorescence (both P<.001).
Figure 3
Figure 3
Findings in a 31-year-old man with serpiginous choroidopathy (patient 1). A, Fundus photograph shows peripapillary chorioretinal atrophy extending into the macula slightly inferior to the fovea. B, The corresponding fundus autofluorescence (FAF) image shows hypoautofluorescence corresponding to chorioretinal atrophy in the quiescent phase of the disease. C, Fluorescein angiography shows uniform hyperfluorescence of the border of atrophy. D, Late-phase staining is seen in the region of scarring. E, During an exacerbation of disease activity, the fundus photograph shows slight discoloration of the retinal pigment epithelium (RPE) (arrow). F, The discoloration of the RPE is highlighted by a hyperautofluorescent signal on FAF imaging (arrow). G, Fluorescein angiography demonstrates hypofluorescence (arrow) in the venous phase of the angiogram. H, Hyperfluorescence (arrow) is seen in the recirculation phase. The findings on fluorescein angiogram were much more subtle than those observed on FAF imaging.
Figure 4
Figure 4
Findings in a 28-year-old man diagnosed as having presumed tuberculosis-associated serpiginouslike choroidopathy of the left eye (patient 6). A, Fundus photograph of the left eye shows widespread retinal pigment epithelial (RPE) hyperpigmentation mixed with atrophic changes. B, The corresponding fundus autofluorescence (FAF) image shows hyperautofluorescence centrally connecting areas of hypoautofluorescence of varying intensities. C, A higher-power magnification of the boxed region in A shows RPE stippling (yellow arrow) and hyperplasia (green arrow). D, The corresponding FAF image shows hyperautofluorescence with hypoautofluorescent stippling (yellow arrow) and hypoautofluorescent patches in the region of RPE hyperplasia (green arrow). The patient was treated with a 4-drug antituberculosis regimen.
Figure 5
Figure 5
Findings in a 28-year-old woman with multifocal choroiditis (patient 10). A, Areas of retinal pigment epithelial (RPE) hyperplasia and a few punctate areas of atrophy and decreased visual acuity to 20/32 are evident. B, The initial fundus autofluorescence (FAF) image shows hyperautofluorescence in the region of the RPE hyperpigmentation with scattered areas of hyperautofluorescence that were difficult to appreciate on fundus photography. C, The corresponding optical coherence tomography (OCT) image shows RPE elevation in the region of RPE hyperpigmentation (arrow). D, Eleven months after cyclosporine therapy, visual acuity improved to 20/16, and the fundus photograph shows minimal RPE change with mottling. E, The corresponding FAF image shows scattered areas of hypoautofluorescence. F, The OCT image shows resolution of the RPE abnormalities (arrow).
Figure 6
Figure 6
Findings in a 35-year-old woman with acute zonal occult outer retinopathy who had photopsias and an enlarged blind spot at the initial examination (patient 25). A, The fundus photograph shows mild retinal pigment epithelial (RPE) atrophy in the peripapillary region that was difficult to appreciate by clinical examination. B, The fundus autofluorescence (FAF) image highlights this peripapillary region of RPE change, seen as hypoautofluorescence with a hyperautofluorescent halo. The FAF image also shows several pinpoint areas of hypoautofluorescence temporal to the fovea (arrow). The patient's examination results and FAF findings remained stable during follow-up.
Figure 7
Figure 7
Findings in a 36-year-old man diagnosed as having relentless placoid chorioretinitis (patient 28). A and B, Fundus photography showed central chorioretinal atrophy and widespread retinal pigment epithelial (RPE) hyperpigmentation with variable atrophy in both eyes. C and D, Fundus autofluorescence imaging highlights these changes, showing widespread hypoautofluorescence in both of the areas of chorioretinal atrophy and RPE hyperpigmentation.

Comment in

References

    1. Quillen DA, Davis JB, Gottlieb JL, et al. The white dot syndromes. Am J Ophthalmol. 2004;137(3):538–550. - PubMed
    1. Matsumoto Y, Haen SP, Spaide RF. The white dot syndromes. Compr Ophthalmol Update. 2007;8(4):179–200. 203–204. - PubMed
    1. Jones BE, Jampol LM, Yannuzzi LA, et al. Relentless placoid chorioretinitis: a new entity or an unusual variant of serpiginous chorioretinitis? Arch Ophthalmol. 2000;118(7):931–938. - PubMed
    1. Gupta V, Gupta A, Arora S, Bambery P, Dogra MR, Agarwal A. Presumed tubercular serpiginouslike choroiditis: clinical presentations and management. Ophthalmology. 2003;110(9):1744–1749. - PubMed
    1. Gass JD. Acute zonal occult outer retinopathy: Donders Lecture: the Netherlands Ophthalmological Society, Maastricht, Holland, June 19, 1992. J Clin Neuroophthalmol. 1993;13(2):79–97. - PubMed

Publication types