

Biodosimetry on small blood volume using gene expression assay
- PMID: 20065681
- PMCID: PMC3677703
- DOI: 10.1097/01.HP.0000346706.44253.5c
Biodosimetry on small blood volume using gene expression assay
Abstract
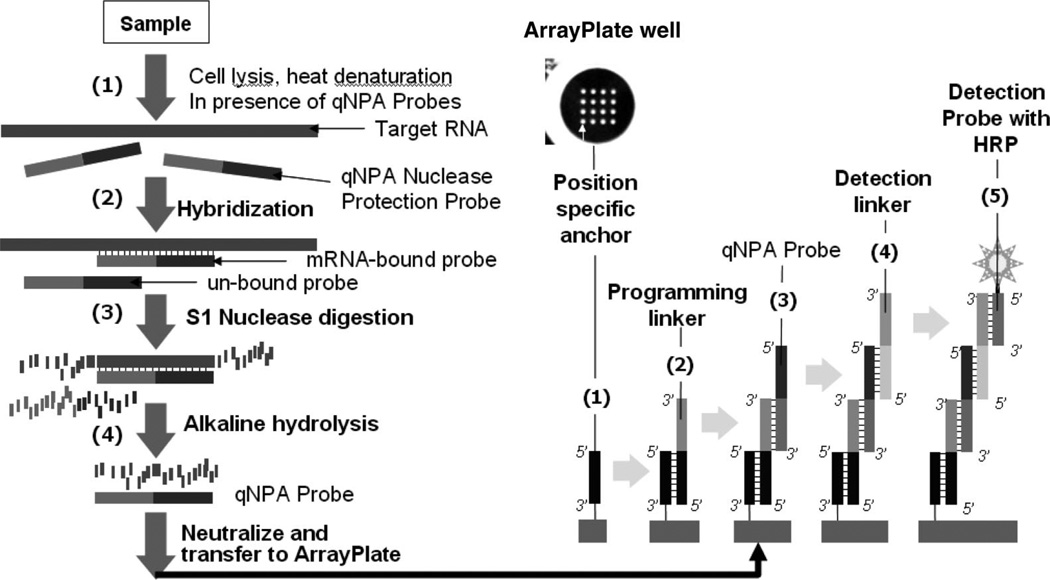
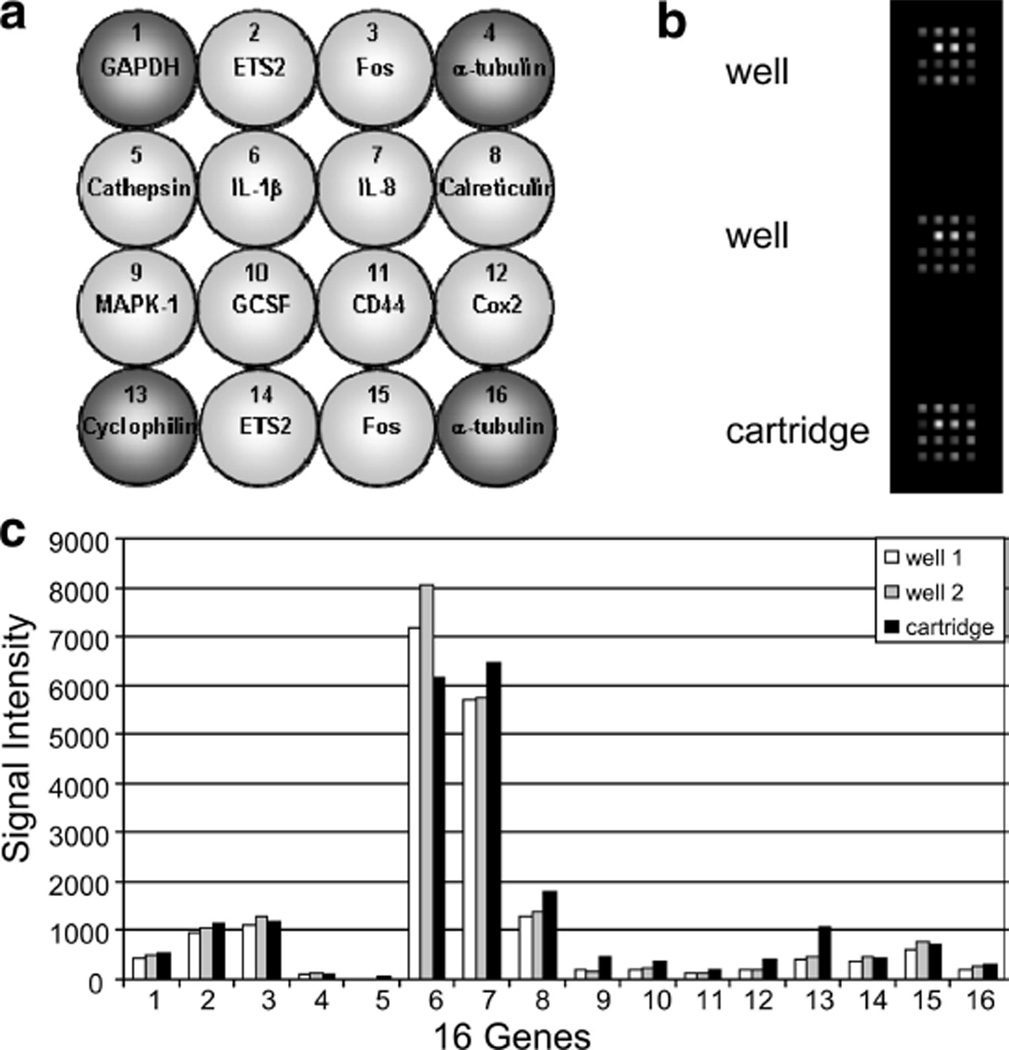
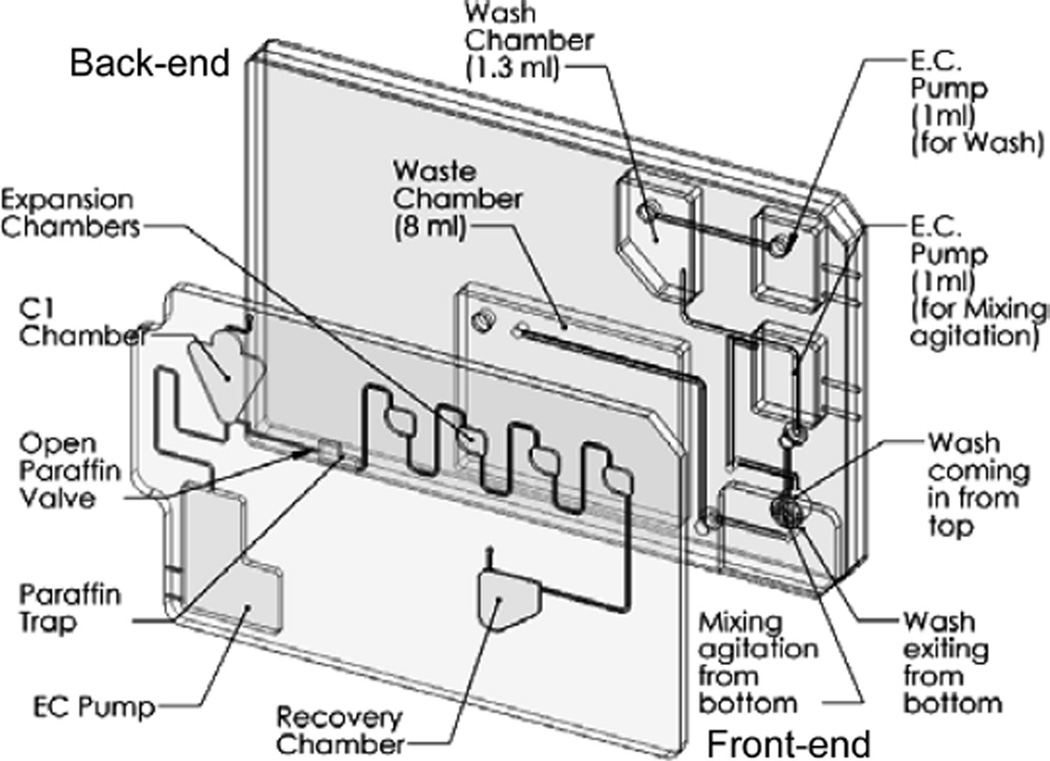
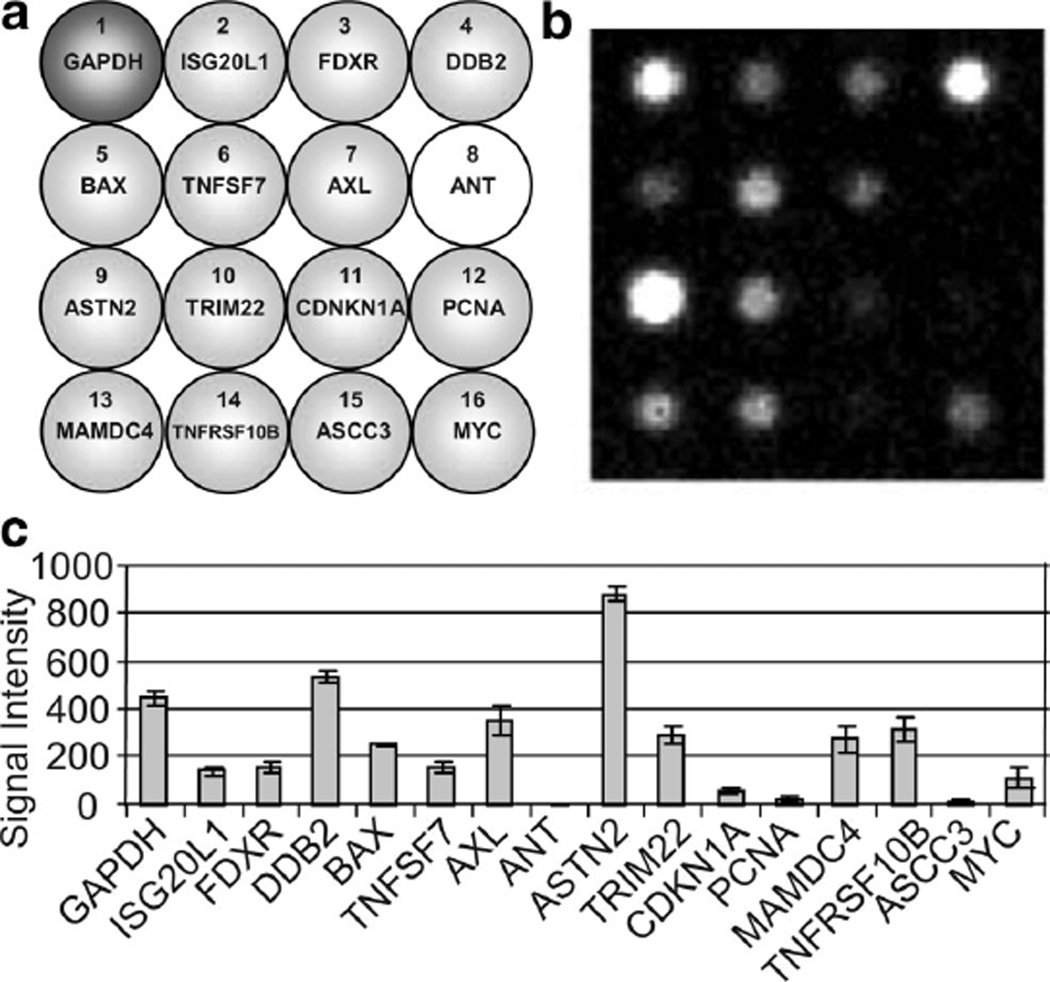
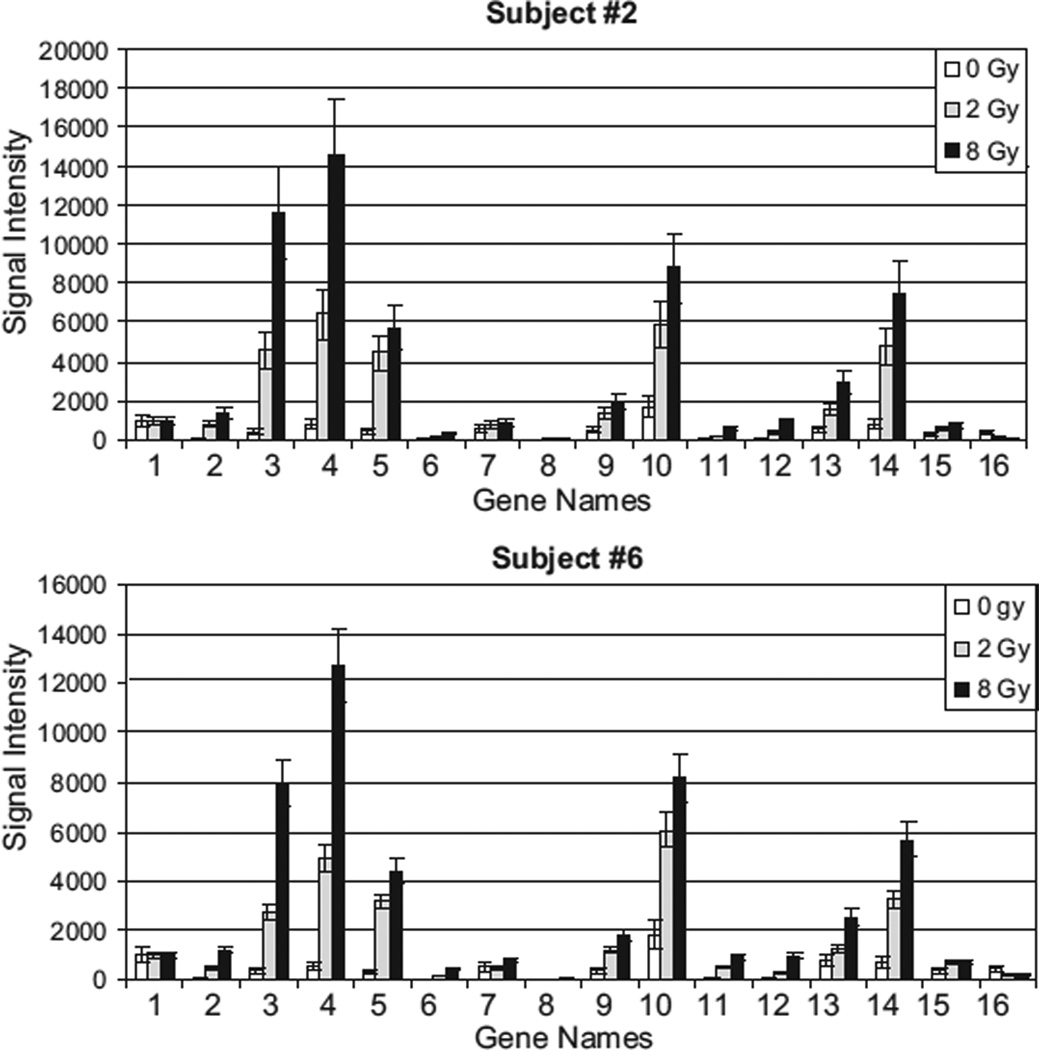
This paper reports the development of a biodosimetry device suitable for rapidly measuring expression levels of a low-density gene set that can define radiation exposure, dose and injury in a public health emergency. The platform comprises a set of 14 genes selected on the basis of their abundance and differential expression level in response to radiation from an expression profiling series measuring 41,000 transcripts. Gene expression is analyzed through direct signal amplification using a quantitative Nuclease Protection Assay (qNPA). This assay can be configured as either a high-throughput microplate assay or as a handheld detection device for individual point-of-care assays. Recently, we were able to successfully develop the qNPA platform to measure gene expression levels directly from human whole blood samples. The assay can be performed with volumes as small as 30 microL of whole blood, which is compatible with collection from a fingerstick. We analyzed in vitro irradiated blood samples with qNPA. The results revealed statistically significant discrimination between irradiated and non-irradiated samples. These results indicate that the qNPA platform combined with a gene profile based on a small number of genes is a valid test to measure biological radiation exposure. The scalability characteristics of the assay make it appropriate for population triage. This biodosimetry platform could also be used for personalized monitoring of radiotherapy treatments received by patients.
Figures
References
-
- Amundson SA, Do KT, Shahab S, Bittner M, Meltzer P, Trent J, Fornace AJ., Jr Identification of potential mRNA biomarkers in peripheral blood lymphocytes for human exposure to ionizing radiation. Radiat Res. 2000;154:342–346. - PubMed
-
- Amundson SA, Bittner M, Meltzer P, Trent J, Fornace AJ., Jr Biological indicators for the identification of ionizing radiation exposure in humans. Expert Rev Mol Diagn. 2001a;1:211–219. - PubMed
-
- Amundson SA, Bittner M, Meltzer P, Trent J, Fornace AJ., Jr Induction of gene expression as a monitor of exposure to ionizing radiation. Radiat Res. 2001b;156:657–661. - PubMed
-
- Amundson SA, Lee RA, Koch-Paiz CA, Bittner ML, Meltzer P, Trent JM, Fornace AJ., Jr Differential responses of stress genes to low dose-rate gamma irradiation. Mol Cancer Res. 2003:1445–1452. - PubMed
-
- Amundson SA, Grace MB, McLeland CB, Epperly MW, Yeager A, Zhan Q, Greenberger JS, Fornace AJ., Jr Human in vivo radiation-induced biomarkers: gene expression changes in radiotherapy patients. Cancer Res. 2004;64:6368–6371. - PubMed
Publication types
MeSH terms
Substances
Grants and funding
LinkOut - more resources
Full Text Sources
Other Literature Sources
