. 2010 Jan 6;5(1):e8602.
doi: 10.1371/journal.pone.0008602.

Anion-sensitive regions of L-type CaV1.2 calcium channels expressed in HEK293 cells

Affiliations

Anion-sensitive regions of L-type CaV1.2 calcium channels expressed in HEK293 cells

Norbert Babai et al. PLoS One. .

Abstract

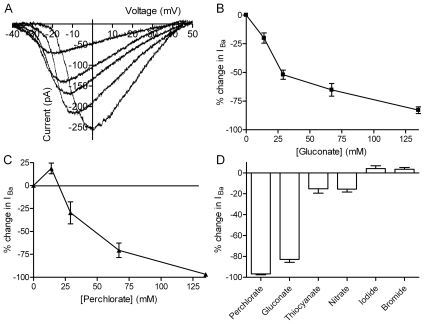
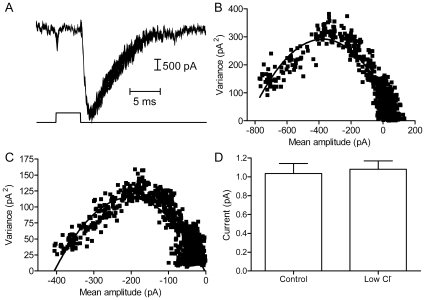
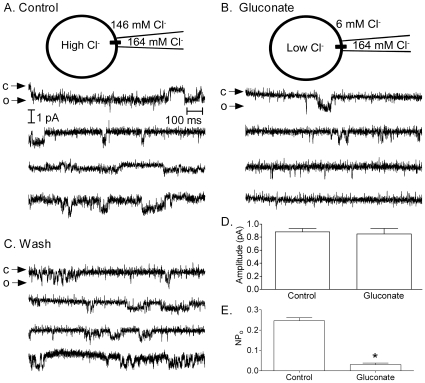
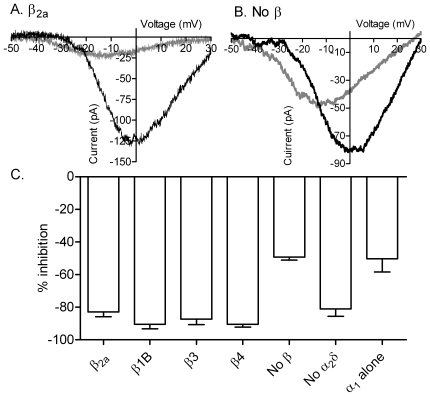
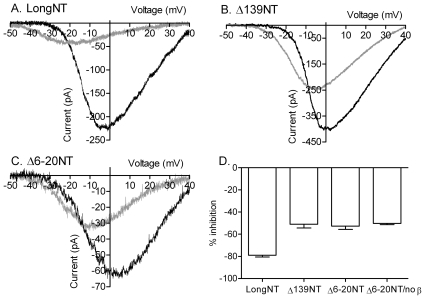
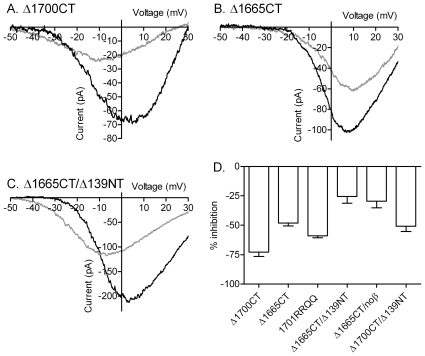
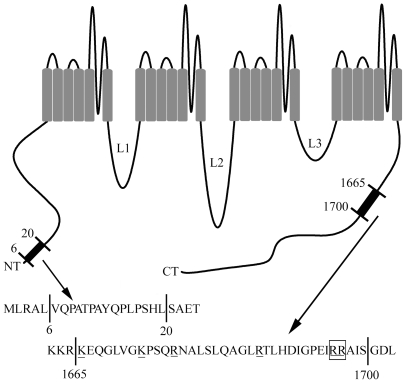
L-type calcium currents (I(Ca)) are influenced by changes in extracellular chloride, but sites of anion effects have not been identified. Our experiments showed that CaV1.2 currents expressed in HEK293 cells are strongly inhibited by replacing extracellular chloride with gluconate or perchlorate. Variance-mean analysis of I(Ca) and cell-attached patch single channel recordings indicate that gluconate-induced inhibition is due to intracellular anion effects on Ca(2+) channel open probability, not conductance. Inhibition of CaV1.2 currents produced by replacing chloride with gluconate was reduced from approximately 75%-80% to approximately 50% by omitting beta subunits but unaffected by omitting alpha(2)delta subunits. Similarly, gluconate inhibition was reduced to approximately 50% by deleting an alpha1 subunit N-terminal region of 15 residues critical for beta subunit interactions regulating open probability. Omitting beta subunits with this mutant alpha1 subunit did not further diminish inhibition. Gluconate inhibition was unchanged with expression of different beta subunits. Truncating the C terminus at AA1665 reduced gluconate inhibition from approximately 75%-80% to approximately 50% whereas truncating it at AA1700 had no effect. Neutralizing arginines at AA1696 and 1697 by replacement with glutamines reduced gluconate inhibition to approximately 60% indicating these residues are particularly important for anion effects. Expressing CaV1.2 channels that lacked both N and C termini reduced gluconate inhibition to approximately 25% consistent with additive interactions between the two tail regions. Our results suggest that modest changes in intracellular anion concentration can produce significant effects on CaV1.2 currents mediated by changes in channel open probability involving beta subunit interactions with the N terminus and a short C terminal region.


Conflict of interest statement

Competing Interests: The authors have declared that no competing interests exist.

Figures

Figure 1
Figure 1. Effects of gluconate and other anions on CaV1.2 currents.
A. CaV1.2 currents (short N-terminal isoform) were progressively inhibited by replacing increasing amounts of extracellular chloride with gluconate. 5 mM Ba2+ was used as a charge carrier and currents were evoked by a ramp voltage protocol (−90 to +60 mV, 0.5 mV/ms). Traces show IBa recorded in control conditions and after 2 min superfusion with solutions containing increasing concentrations of gluconate (14 mM, 28 mM, 68 mM, and 135 mM). Leak currents were removed by subtracting the ohmic conductance measured below IBa threshold. B. Increasing gluconate concentration caused a concentration-dependent increase in inhibition of the peak amplitude of CaV1.2 currents. A gluconate concentration of 14 mM caused 20.1±4.4% (N = 14) inhibition whereas 135 mM gluconate caused 82.9±2.9% inhibition (N = 28). C. Replacing 14 mM Cl with equimolar perchlorate increased CaV1.2 currents (18.7±5.8%, N = 6) but further increases in perchlorate concentration caused a concentration-dependent inhibition of CaV1.2 currents with −96.8±0.9% inhibition (N = 7) at a perchlorate concentration of 135 mM. D. Bar graph comparing effects of replacing 135 mM Cl with equimolar quantities of perchlorate (N = 7), gluconate (N = 28), thiocyanate (N = 8), nitrate (N = 9), iodide (N = 10) and bromide (N = 9). All of these experiments were performed using α12a2δ.
Figure 2
Figure 2. Replacing chloride with gluconate did not alter single channel amplitude of CaV1.2 currents.
A. Overlaid traces showing a series of 100 test steps (5 ms, −70 to +50 mV). Passive membrane properties were subtracted using a P/200 protocol. B. The mean amplitude of the IBa tail current (A) was plotted against the variance at each time point (beginning at the peak inward current). The relationship between mean and inter-trial variance at different time points was fit with a parabolic function (see Methods). The best fit with this function indicates that IBa resulted from 746±21 channels with a single channel amplitude averaging −1.01±0.02 pA. C. Replacing 29 mM Cl with equimolar gluconate inhibited the amplitude of IBa by 48% in this cell, but the best fit parabola to the mean/variance relationship showed little change in single channel current amplitude (−1.15±0.03 pA). D. On average, lowering chloride had no significant effect on single channel current amplitude (control: −1.04±0.11 pA, N = 19; 29 mM gluconate: −1.08±0.09 pA, N = 19, P = 0.76).
Figure 3
Figure 3. Gluconate replacement acts inside the cell to reduce Ca2+ channel open probability.
CaV1.2 channel openings were recorded using the cell-attached patch configuration. Inward currents into the cell are shown as downward deflections. Panel A shows a sequence of 4 sweeps in control conditions. Panel B shows that that the number of channel openings dropped dramatically when extracellular Cl was replaced with gluconate (135 mM). Panel C shows that channel openings recovered after washout. The extracellular channel surface was continuously exposed to 164 mM Cl in the recording pipette suggesting that the reduction in channel opening are due to intracellular effects of gluconate replacement. For illustration, currents were smoothed by Butterworth filtering (8-pole, 800Hz). D. The amplitude of single channel currents was not significantly reduced by gluconate (N = 7, P = 0.38, paired t-test). C. Channel open probability (NPo) was significantly reduced by gluconate replacement (N = 7, P<0.0001, paired t-test). Control data were analyzed from sweeps obtained at an estimated trans-membrane potential across the patch of ∼−12 mV. Gluconate sweeps were analyzed using a 10 mV more positive test pulse to compensate for the ∼10 mV depolarization of HEK293 cells produced by the gluconate solution.
Figure 4
Figure 4. α1 and β subunits are involved in anion interactions with CaV1.2.
A. IBa recorded from a cell expressing short N terminal CaV1.2 with α2δ and β2a. Currents were recorded in control conditions (black trace) and after replacing 135 mM chloride with gluconate (gray trace). IBa was recorded using a ramp voltage protocol (−90 to +60 mV, 0.5 mV/ms). B. Gluconate replacement produced less inhibition of IBa when CaV1.2 was expressed without β subunits. C. Bar graph illustrating the inhibition of IBa peak amplitude produced by gluconate replacement when CaV1.2 was expressed with β2a and α2δ (reduction in amplitude: 82.9±2.9%; N = 19; reduction in Gmax: 72.0% ), without β subunits (amplitude, −44.2±1.8%; N = 7; ΔGmax, −46.1%), without α2δ (amplitude, −81.0±4.6%, N = 8; ΔGmax, −80.0%), and after omission of both β2a and α2δ subunits (amplitude, −50.3±8.1%; N = 8; ΔGmax, −49.9%). Inhibition of IBa by gluconate replacement was significantly reduced by omission of β subunits (P<0.001, unpaired t-test) or simultaneous omission of both β and α2δ subunits (P<0.001). Varying the β subunit composition had no significant effect (P = 0.81, ANOVA) on gluconate inhibition of CaV1.2 amplitude (β1b, N = 7, 90.4±2.7% inhibition of amplitude, 84.6% inhibition of Gmax; β3, N = 12, amplitude −87.3±3.3%, ΔGmax −67.8%; β4, N = 8, amplitude −90.4±1.8%, ΔGmax −76.4%).
Figure 5
Figure 5. N-terminal regions involved in gluconate inhibition of CaV1.2.
A. IBa from cardiac-derived long N-terminal CaV1.2 co-expressed with β2A and α2δ. The long N-terminal isoform showed a similar reduction in IBa after gluconate replacement (gray trace) as the short N terminal isoform of CaV1.2 used in previous figures. B. IBa from a mutant CaV1.2 in which the N-terminus was truncated at residue AA 139 (Δ139) recorded in control conditions (black trace) and after replacing chloride with gluconate (gray trace). C. IBa after deletion of residues AA 6–20 on the N-terminus (Δ6–20) from long N-terminal CaV1.2 in control (black trace) and low chloride (gray trace) conditions. D. Bar graph showing the percentage inhibition of IBa peak amplitude produced by gluconate replacement in the different experiments. Compared to the long N-terminal isoform of rabbit CaV1.2 (−78.2±1.5%; ΔGmax −71.9%, N = 16), truncating the N terminus at residue 139 (Δ139: −54.0±3.3%; ΔGmax −48.0%; N = 9), deletion of residues 6–20 (Δ6–20: −53.7±2.6%; ΔGmax −51.6%, N = 17), or expression of Δ6–20 mutant without β subunits (−50.2±1.1%; ΔGmax −44.7%, N = 8) all reduced inhibition of IBa by gluconate replacement from ∼75% to ∼50%.
Figure 6
Figure 6. Contributions of the C terminus to anion sensitivity of CaV1.2 currents.
A. Long NT CaV1.2 current after deletion of the C terminus at residue 1700 (Δ1700CT) in control conditions (black trace) and after replacing chloride with gluconate (gray trace). B. CaV1.2 current after deletion of the C terminus at residue 1665 (Δ1665CT) in control (black trace) and gluconate (gray trace) conditions. C. IBa from a mutant lacking both C- and N-termini (Δ1665/Δ139) in control (black trace) and gluconate (gray trace) conditions. D. Bar graph comparing the inhibition of IBa peak amplitude produced by gluconate replacement in the different mutants. Truncating the C terminus of rabbit CaV1.2 at AA 1700 (Δ1700) showed no reduction in gluconate inhibition (−72.3±2.0%, N = 4; ΔGmax −73.9%) compared to full length CaV1.2. However, removing an additional 35 residues by truncating the C terminus at AA 1665 (Δ1665) reduced gluconate inhibition significantly (P<0.0001) to 48.1±2.5% (N = 23; ΔGmax −45.8%). Two positively charged residues in this region were neutralized in a Δ1701 truncation mutant by replacing arginine with glutamine at AA1696 and 1697. Replacing these two residues reduced gluconate inhibition to 58.0±2.1% (N = 7; ΔGmax −43.0%). Inhibition was more strongly reduced in channels lacking both C- and N-termini (Δ1665/Δ139: −25.4±6.9%, N = 5, comparison to Δ1665 with β subunits, P<0.0011; ΔGmax −35.4%) as well as in Δ1665 channels expressed without β subunits (−29.4±5.8%, N = 7, comparison to Δ1665 with β subunits, P<0.003; ΔGmax −25.6%). Gluconate inhibition in the Δ139/Δ1700 double mutant (−50.8±4.4%, N = 7; ΔGmax −41.0%) did not differ from gluconate inhibition in the Δ139 mutant. Except where specified, α1 subunits were co-expressed with α2δ and β2A.
Figure 7
Figure 7. Diagram of the long NT CaV1.2 α1 subunit highlighting anion-sensitive regions.
Our results show that anion modulation of the long NT isoform of CaV1.2 involves the interaction between β subunits and a short N terminal region between residues AA 6–20. The absence of positively charged lysine or arginine residues in this region suggests that anions do not bind directly to this region but may instead interact with residues on the β subunit. We also identified sites of anion interaction in a C terminal region between AA 1665–1700. Two neighboring arginine residues at positions 1696 and 1697 are particularly important for these interactions.

References

    1. Lipscombe D, Helton TD, Xu W. L-type calcium channels: The low down. J Neurophysiol. 2004;92:2633–2641. - PubMed
    1. Mears D. Regulation of insulin secretion in islets of Langerhans by Ca(2+)channels. J Membr Biol. 2004;200:57–66. - PubMed
    1. Bodi I, Mikala G, Koch SE, Akhter SA, Schwartz A. The L-type calcium channel in the heart: The beat goes on. J Clin Invest. 2005;115:3306–3317. - PMC - PubMed
    1. Heidelberger R, Thoreson WB, Witkovsky P. Synaptic transmission at retinal ribbon synapses. Prog Retin Eye Res. 2005;24:682–720. - PMC - PubMed
    1. Kobayashi T, Yamada Y, Fukao M, Tsutsuura M, Tohse N. Regulation of Cav1.2 current: Interaction with intracellular molecules. J Pharmacol Sci. 2007;103:347–353. - PubMed

Publication types