

An eQTL analysis of partial resistance to Puccinia hordei in barley
- PMID: 20066049
- PMCID: PMC2798965
- DOI: 10.1371/journal.pone.0008598
An eQTL analysis of partial resistance to Puccinia hordei in barley
Abstract
Background: Genetic resistance to barley leaf rust caused by Puccinia hordei involves both R genes and quantitative trait loci. The R genes provide higher but less durable resistance than the quantitative trait loci. Consequently, exploring quantitative or partial resistance has become a favorable alternative for controlling disease. Four quantitative trait loci for partial resistance to leaf rust have been identified in the doubled haploid Steptoe (St)/Morex (Mx) mapping population. Further investigations are required to study the molecular mechanisms underpinning partial resistance and ultimately identify the causal genes.
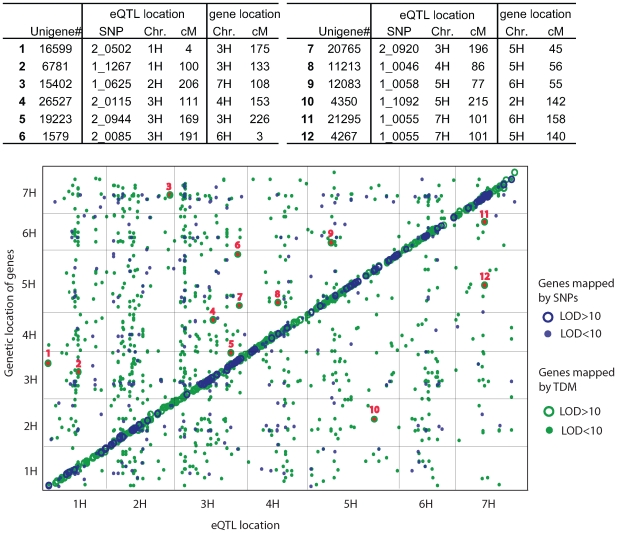
Methodology/principal findings: We explored partial resistance to barley leaf rust using a genetical genomics approach. We recorded RNA transcript abundance corresponding to each probe on a 15K Agilent custom barley microarray in seedlings from St and Mx and 144 doubled haploid lines of the St/Mx population. A total of 1154 and 1037 genes were, respectively, identified as being P. hordei-responsive among the St and Mx and differentially expressed between P. hordei-infected St and Mx. Normalized ratios from 72 distant-pair hybridisations were used to map the genetic determinants of variation in transcript abundance by expression quantitative trait locus (eQTL) mapping generating 15685 eQTL from 9557 genes. Correlation analysis identified 128 genes that were correlated with resistance, of which 89 had eQTL co-locating with the phenotypic quantitative trait loci (pQTL). Transcript abundance in the parents and conservation of synteny with rice allowed us to prioritise six genes as candidates for Rphq11, the pQTL of largest effect, and highlight one, a phospholipid hydroperoxide glutathione peroxidase (HvPHGPx) for detailed analysis.
Conclusions/significance: The eQTL approach yielded information that led to the identification of strong candidate genes underlying pQTL for resistance to leaf rust in barley and on the general pathogen response pathway. The dataset will facilitate a systems appraisal of this host-pathogen interaction and, potentially, for other traits measured in this population.
Conflict of interest statement
Figures


Similar articles
-
Differential gene expression in nearly isogenic lines with QTL for partial resistance to Puccinia hordei in barley.BMC Genomics. 2010 Nov 11;11:629. doi: 10.1186/1471-2164-11-629. BMC Genomics. 2010. PMID: 21070652 Free PMC article.
-
Exploiting regulatory variation to identify genes underlying quantitative resistance to the wheat stem rust pathogen Puccinia graminis f. sp. tritici in barley.Theor Appl Genet. 2008 Jul;117(2):261-72. doi: 10.1007/s00122-008-0771-x. Epub 2008 Apr 30. Theor Appl Genet. 2008. PMID: 18542913
-
Combining genetical genomics and bulked segregant analysis-based differential expression: an approach to gene localization.Theor Appl Genet. 2011 May;122(7):1375-83. doi: 10.1007/s00122-011-1538-3. Epub 2011 Jan 26. Theor Appl Genet. 2011. PMID: 21267709 Free PMC article.
-
Identification of QTL conferring resistance to stripe rust (Puccinia striiformis f. sp. hordei) and leaf rust (Puccinia hordei) in barley using nested association mapping (NAM).PLoS One. 2018 Jan 25;13(1):e0191666. doi: 10.1371/journal.pone.0191666. eCollection 2018. PLoS One. 2018. PMID: 29370232 Free PMC article.
-
Leaf rust of cultivated barley: pathology and control.Annu Rev Phytopathol. 2015;53:565-89. doi: 10.1146/annurev-phyto-080614-120324. Epub 2015 Jun 5. Annu Rev Phytopathol. 2015. PMID: 26047566 Review.
Cited by
-
Molecular mechanisms underpinning quantitative resistance to Phytophthora sojae in Glycine max using a systems genomics approach.Front Plant Sci. 2023 Nov 7;14:1277585. doi: 10.3389/fpls.2023.1277585. eCollection 2023. Front Plant Sci. 2023. PMID: 38023885 Free PMC article.
-
OsSYP121 Accumulates at Fungal Penetration Sites and Mediates Host Resistance to Rice Blast.Plant Physiol. 2019 Apr;179(4):1330-1342. doi: 10.1104/pp.18.01013. Epub 2019 Jan 7. Plant Physiol. 2019. PMID: 30617050 Free PMC article.
-
Transcriptional responses of Italian ryegrass during interaction with Xanthomonas translucens pv. graminis reveal novel candidate genes for bacterial wilt resistance.Theor Appl Genet. 2011 Feb;122(3):567-79. doi: 10.1007/s00122-010-1470-y. Epub 2010 Oct 26. Theor Appl Genet. 2011. PMID: 20976589
-
The Quantitative Basis of the Arabidopsis Innate Immune System to Endemic Pathogens Depends on Pathogen Genetics.PLoS Genet. 2016 Feb 11;12(2):e1005789. doi: 10.1371/journal.pgen.1005789. eCollection 2016 Feb. PLoS Genet. 2016. PMID: 26866607 Free PMC article.
-
Polygenic pathogen networks influence transcriptional plasticity in the Arabidopsis-Botrytis pathosystem.Genetics. 2023 Jul 6;224(3):iyad099. doi: 10.1093/genetics/iyad099. Genetics. 2023. PMID: 37216906 Free PMC article.
References
-
- Mammadov JA, Zwonitzer JC, Biyashev RM, Griffey CA, Jin Y, et al. Molecular mapping of leaf rust resistance gene Rph5 in barley. Crop Science. 2003;43:388–393.
-
- Weerasena JS, Steffenson BJ, Falk AB. Conversion of an amplified fragment length polymorphism marker into a co-dominant marker in the mapping of the Rph15 gene conferring resistance to barley leaf rust, Puccinia hordei Otth/Weerasena. Theoretical and Applied Genetics. 2004;108:712–719. - PubMed
-
- Niks RE, Waalther U, Jaiser H, Martinez F, Rubiales D, et al. Resistance against barley leaf rust (Puccinia hordei) in West-European spring barley germplasm. Agronomie. 2000;20:769–782.
-
- Marcel TC, Varshney RK, Barbieri M, Jafary H, de Kock MJD, et al. A high-density consensus map of barley to compare the distribution of QTLs for partial resistance to Puccinia hordei and of defence gene homologues. Theoretical and Applied Genetics. 2007;114:487–500. - PubMed
-
- Jansen RC, Nap JP. Genetical genomics: the added value from segregation. Trends in Genetics. 2001;17:388–391. - PubMed
Publication types
MeSH terms
LinkOut - more resources
Full Text Sources
Medical
