Review
. 2009 Jul;1(1):a002022.
doi: 10.1101/cshperspect.a002022.

The measure of success: constraints, objectives, and tradeoffs in morphogen-mediated patterning

Affiliations
Review

The measure of success: constraints, objectives, and tradeoffs in morphogen-mediated patterning

Arthur D Lander et al. Cold Spring Harb Perspect Biol. 2009 Jul.

Abstract

A large, diverse, and growing number of strategies have been proposed to explain how morphogen gradients achieve robustness and precision. We argue that, to be useful, the evaluation of such strategies must take into account the constraints imposed by competing objectives and performance tradeoffs. This point is illustrated through a mathematical and computational analysis of the strategy of self-enhanced morphogen clearance. The results suggest that the usefulness of this strategy comes less from its ability to increase robustness to morphogen source fluctuations per se, than from its ability to overcome specific kinds of noise, and to increase the fraction of a morphogen gradient within which robust threshold positions may be established. This work also provides new insights into the longstanding question of why morphogen gradients show a maximum range in vivo.


Figures

Figure 1.
Figure 1.
Gradient decay mechanisms and robustness to rates of morphogen synthesis. (A) According to equations 1 and 2, morphogen gradients with uniform decay (UD) and self-enhanced clearance (SEC) will be equally robust to morphogen synthesis rates if they display the same length scale near the source. If they start from the same initial concentration, however, the UD gradient will fall increasingly below the SEC gradient as one moves further from the source (arrows show morphogen levels at the location where Sx,y0, the sensitivity of threshold location to initial morphogen concentration, equals 0.3). (B) For any UD gradient, equivalent robustness to morphogen synthesis rate and equivalent morphogen levels at any single threshold point can be achieved by initiating the UD gradient from a higher starting value. (C) According to equations 1 and 2, the amount by which a UD or SEC gradient shifts in response to a twofold change in morphogen synthesis is ln2 times the length scale at the source. However, outside the regime of very low receptor saturation, the shift can be much larger, as shown in (D). (D) Units of free morphogen concentration are scaled to Km, such that the value of 0.28 corresponds to 22% receptor saturation. (E,F) When receptor saturation is not negligible, morphogen concentration near the source can go up steeply with morphogen synthesis rate. Sy0,ν is the coefficient of sensitivity of y0 (morphogen level at x = 0, scaled to Km) to the rate of morphogen synthesis, and is plotted in panel E as a function of y0 and in panel F as a function of θ0, receptor saturation at x = 0. Note that the results depend on the size of the morphogen production region relative to the length scale parameter, which determines the fraction of morphogen molecules that are cleared within the production region, as opposed to diffusing away from it.
Figure 2.
Figure 2.
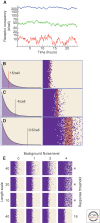
Binding noise and background noise in morphogen detection and patterning. (A) Stochastic simulations were performed to visualize predicted fluctuations in receptor occupancy on cells with mean occupancies of 9.1 (red), 45.5 (green), or 227 (blue) receptors per cell. A logarithmic axis is used to show that the relative contribution of binding noise goes down as occupancy goes up. For the rate parameters used here (kdeg = 2 × 10⁻⁴/sec for bound receptors and 10−4/sec for free; koffkdeg; receptor synthesis rates of 72 [red], 360 [green], and 1800 [blue] molecules/cell/h), the time course of the fluctuations is on the order of an hour, and therefore likely to be physiologically relevant. (B–D) Effect of binding noise on patterning. Simulations were performed to show the expected behavior of a field of 50 × 70 cells, exposed to an exponentially declining morphogen gradient with length scale of 10 cell diameters, in which initial morphogen concentration is sufficient to occupy 50 receptors per cell, and thresholds for activating gene expression (represented by a color change from light to dark) occur at occupancy levels of 15 (B), 4 (C), or 0.5 (D) receptors per cell. As expected, the width of the variegated response region increases with lower occupancy thresholds; this is quantified by overlaid pink boxes, which mark the regions within which cells have more than a 15% chance of responding inappropriately for their position. (E) Effects of background noise. Simulations were performed as in B–D, except that background (Gaussian) noise was added at a mean level equivalent to the occupancy of 1, 2, or 4 receptors per cell, with a coefficient of variation of 30%. The effects of background noise become significant only when it nears the cell response threshold. Whereas decreasing the gradient length scale is an effective strategy for minimizing the effects of binding noise, it has little effect on background noise, which can only be overcome by raising the response threshold.
Figure 3.
Figure 3.
Comparing performance of different gradient strategies. (A) Exact expressions for Sx (robustness of position with respect to morphogen synthesis rate) for UD and SEC gradient mechanisms were evaluated for a series of values of λ0 (length scale at x = 0), at the farthest location where the transition width w (positional uncertainty because of binding noise), remains below a maximum allowable value (in this example, 4 µm, assuming a receptor density of 4500/cell). Sx for SEC1 gradients was subtracted from Sx for UD gradients to yield ΔSx, the robustness improvement because of SEC. Under most circumstances, ΔSx is relatively small (ΔSx = 0.1 means a twofold change in ν produces a 20.1-fold (7.2%) smaller change in x in SEC vs. UD gradients). Values of λ0, in micrometers, are 1 (yellow), 2.5 (red), 5 (green), 7.5 (blue), 10 (orange), 12.5 (purple), and 15 (black). For these calculations, the size of the morphogen production region was assumed to be ≪ λ̄ (which minimizes degradation of robustness) (Figure 1E,F). For different receptor levels, identical curves are obtained if w is adjusted in proportion to the square root of the receptor level. (B) Receptor occupancy, robustness (Sx), and transition width because of binding noise (w), calculated empirically, for a simulated UD gradient (20 µm production region; 4485 receptors per cell; D = 10 µm2/sec). Thresholds xS, in which Sx = 0.3, and xw, in which w = 4, are shown. Note that only a small fraction of the gradient lies between xw and xS (the “useful region”). (C) Predicted sizes of useful regions of UD gradients of different λ0 (values shown beside each curve, color coded as in panel A), as a function of xw, the maximum patterning width (calculations assume small production region). Moving clockwise around each loop, one encounters gradients with initial receptor occupancies, θ0, running from low to high (curves change from solid to dashed at the point where θ0 = 0.5). (D) A set of random UD gradient profiles (covering a wide range of parameter values) was generated as in panel B, and values of xS and xw were calculated empirically. Note the good agreement with panel C, except for very small λ0 (when the assumption of small production region size is least valid). (E) Predicted sizes of useful regions of SEC1 gradients of different λ0, plotted as in C. Note that in both C and E, the size of the useful region is generally maximized when receptors are moderately saturated at the source (θ0 close to 0.5). This provides a strong theoretical argument why real morphogen gradients are unlikely to operate under conditions in which the effects of receptor saturation can be neglected!

Similar articles

Cited by

References

    1. Adachi-Yamada T, O'Connor MB 2002. Morphogenetic apoptosis: a mechanism for correcting discontinuities in morphogen gradients. Developmental Biol 251:74–90 - PubMed
    1. Akiyama T, Kamimura K, Firkus C, Takeo S, Shimmi O, Nakato H 2008. Dally regulates Dpp morphogen gradient formation by stabilizing Dpp on the cell surface. Developmental Biol 313:408–419 - PMC - PubMed
    1. Amonlirdviman K, Khare NA, Tree DR, Chen WS, Axelrod JD, Tomlin CJ 2005. Mathematical modeling of planar cell polarity to understand domineering nonautonomy. Science 307:423–426 - PubMed
    1. Ashe HL, Briscoe J 2006. The interpretation of morphogen gradients. Development 133:385–394 - PubMed
    1. Ben-Zvi D, Shilo BZ, Fainsod A, Barkai N 2008. Scaling of the BMP activation gradient in Xenopus embryos. Nature 453:1205–1211 - PubMed

Publication types