

Graded dorsal and differential gene regulation in the Drosophila embryo
- PMID: 20066095
- PMCID: PMC2773625
- DOI: 10.1101/cshperspect.a000836
Graded dorsal and differential gene regulation in the Drosophila embryo
Abstract
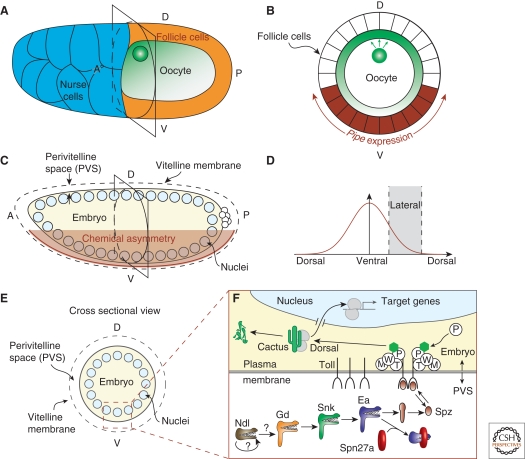
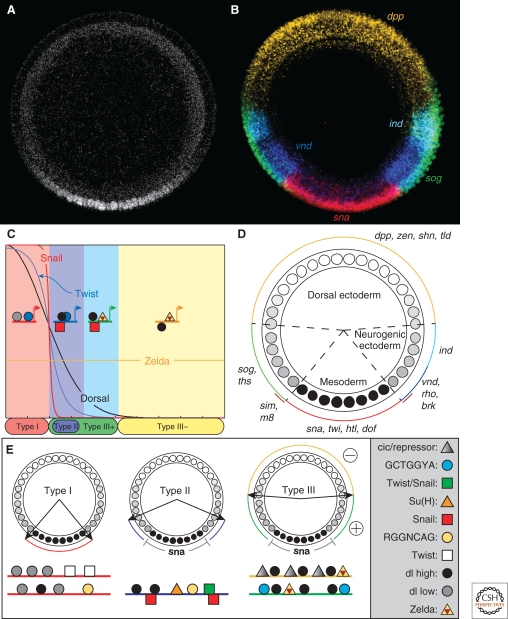
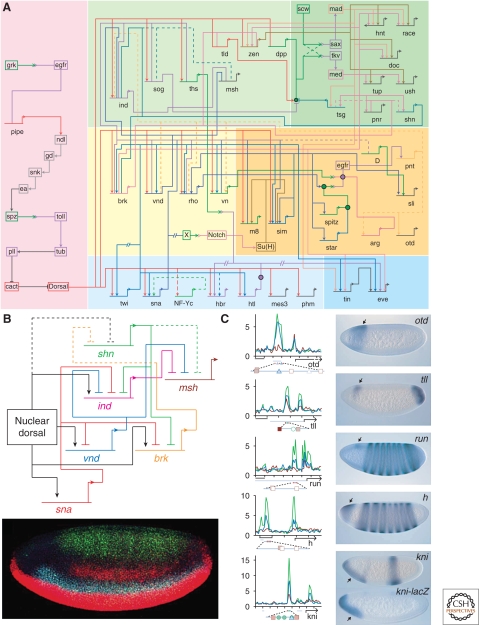
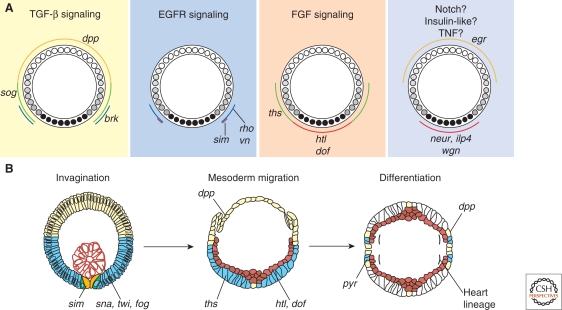
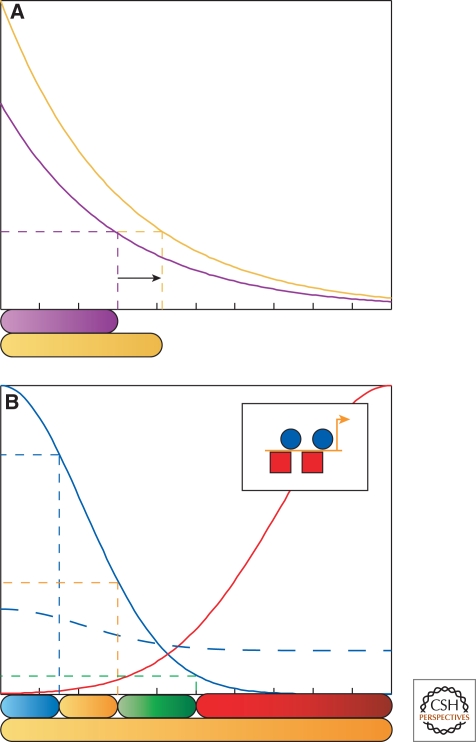
A gradient of Dorsal activity patterns the dorsoventral (DV) axis of the early Drosophila melanogaster embryo by controlling the expression of genes that delineate presumptive mesoderm, neuroectoderm, and dorsal ectoderm. The availability of the Drosophila melanogaster genome sequence has accelerated the study of embryonic DV patterning, enabling the use of systems-level approaches. As a result, our understanding of Dorsal-dependent gene regulation has expanded to encompass a collection of more than 50 genes and 30 cis-regulatory sequences. This information, which has been integrated into a spatiotemporal atlas of gene regulatory interactions, comprises one of the best-understood networks controlling any developmental process to date. In this article, we focus on how Dorsal controls differential gene expression and how recent studies have expanded our understanding of Drosophila embryonic development from the cis-regulatory level to that controlling morphogenesis of the embryo.
Figures
Similar articles
-
Setting up for gastrulation: D. melanogaster.Curr Top Dev Biol. 2020;136:3-32. doi: 10.1016/bs.ctdb.2019.11.004. Epub 2019 Dec 12. Curr Top Dev Biol. 2020. PMID: 31959292 Free PMC article. Review.
-
Quantitative imaging of the Dorsal nuclear gradient reveals limitations to threshold-dependent patterning in Drosophila.Proc Natl Acad Sci U S A. 2009 Dec 29;106(52):22317-22. doi: 10.1073/pnas.0906227106. Epub 2009 Dec 16. Proc Natl Acad Sci U S A. 2009. PMID: 20018754 Free PMC article.
-
Localized repressors delineate the neurogenic ectoderm in the early Drosophila embryo.Dev Biol. 2005 Apr 15;280(2):482-93. doi: 10.1016/j.ydbio.2005.02.003. Dev Biol. 2005. PMID: 15882587
-
Global analysis of dorsoventral patterning in the wasp Nasonia reveals extensive incorporation of novelty in a regulatory network.BMC Biol. 2016 Aug 1;14:63. doi: 10.1186/s12915-016-0285-y. BMC Biol. 2016. PMID: 27480122 Free PMC article.
-
Stepwise Progression of Embryonic Patterning.Trends Genet. 2016 Jul;32(7):432-443. doi: 10.1016/j.tig.2016.04.004. Epub 2016 May 24. Trends Genet. 2016. PMID: 27230753 Free PMC article. Review.
Cited by
-
Ectopic expression screen identifies genes affecting Drosophila mesoderm development including the HSPG Trol.G3 (Bethesda). 2014 Dec 23;5(2):301-13. doi: 10.1534/g3.114.015891. G3 (Bethesda). 2014. PMID: 25538103 Free PMC article.
-
Variation in the dorsal gradient distribution is a source for modified scaling of germ layers in Drosophila.Curr Biol. 2013 Apr 22;23(8):710-6. doi: 10.1016/j.cub.2013.03.031. Epub 2013 Apr 11. Curr Biol. 2013. PMID: 23583556 Free PMC article.
-
Setting up for gastrulation: D. melanogaster.Curr Top Dev Biol. 2020;136:3-32. doi: 10.1016/bs.ctdb.2019.11.004. Epub 2019 Dec 12. Curr Top Dev Biol. 2020. PMID: 31959292 Free PMC article. Review.
-
Tissue-specific RNA Polymerase II promoter-proximal pause release and burst kinetics in a Drosophila embryonic patterning network.Genome Biol. 2024 Jan 2;25(1):2. doi: 10.1186/s13059-023-03135-0. Genome Biol. 2024. PMID: 38166964 Free PMC article.
-
Minimal synthetic enhancers reveal control of the probability of transcriptional engagement and its timing by a morphogen gradient.Cell Syst. 2023 Mar 15;14(3):220-236.e3. doi: 10.1016/j.cels.2022.12.008. Epub 2023 Jan 24. Cell Syst. 2023. PMID: 36696901 Free PMC article.
References
-
- Adams MD, Celniker SE, Holt RA, Evans CA, Gocayne JD, Amanatides PG, Scherer SE, Li PW, Hoskins RA, Galle RF, et al.2000. The genome sequence of Drosophila melanogaster. Science 287:2185–2195 - PubMed
-
- Anderson KV 1998. Pinning down positional information: dorsal-ventral polarity in the Drosophila embryo. Cell 95:439–442 - PubMed
-
- Anderson KV, Jurgens G, Nusslein-Volhard C 1985. Establishment of dorsal-ventral polarity in the Drosophila embryo: Genetic studies on the role of the Toll gene product. Cell 42:779–789 - PubMed
-
- Araujo H, Bier E 2000. sog and dpp exert opposing maternal functions to modify toll signaling and pattern the dorsoventral axis of the Drosophila embryo. Development 127:3631–3644 - PubMed
-
- Beiman M, Shilo BZ, Volk T 1996. Heartless, a Drosophila FGF receptor homolog, is essential for cell migration and establishment of several mesodermal lineages. Genes Dev 10:2993–3002 - PubMed
Publication types
MeSH terms
Grants and funding
LinkOut - more resources
Full Text Sources
Molecular Biology Databases
Research Materials