Review
. 2009 Nov;1(5):a001990.
doi: 10.1101/cshperspect.a001990.

Robust generation and decoding of morphogen gradients

Affiliations
Review

Robust generation and decoding of morphogen gradients

Naama Barkai et al. Cold Spring Harb Perspect Biol. 2009 Nov.

Abstract

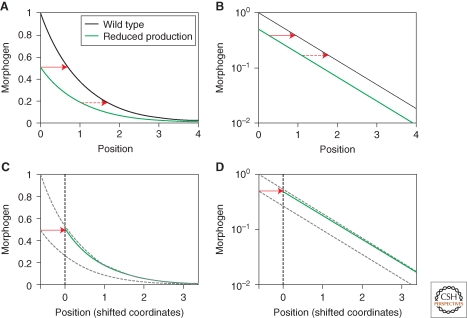
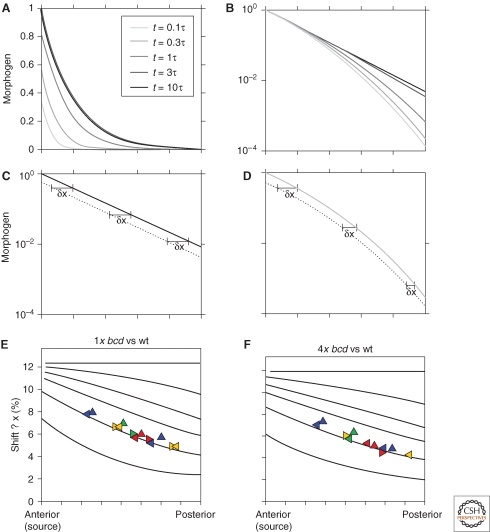
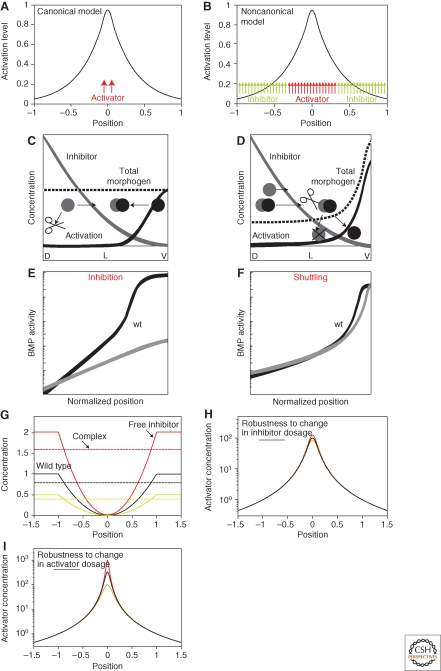
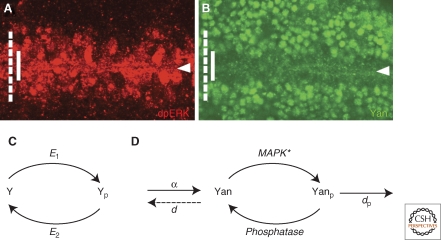
Morphogen gradients play a key role in multiple differentiation processes. Both the formation of the gradient and its interpretation by the receiving cells need to occur at high precision to ensure reproducible patterning. This need for quantitative precision is challenged by fluctuations in the environmental conditions and by variations in the genetic makeup of the developing embryos. We discuss mechanisms that buffer morphogen profiles against variations in gene dosage. Self-enhanced morphogen degradation and pre-steady-state decoding provide general means for buffering the morphogen profile against fluctuations in morphogen production rate. A more specific "shuttling" mechanism, which establishes a sharp and robust activation profile of a widely expressed morphogen, and enables the adjustment of morphogen profile with embryo size, is also described. Finally, we consider the transformation of the smooth gradient profile into sharp borders of gene expression in the signal-receiving cells. The integration theory and experiments are increasingly used, providing key insights into the system-level functioning of the developmental system.


Figures

Figure 1.
Figure 1.
Shift morphogen in profile following perturbation in morphogen production rate. (A–B) Steady-state morphogen profiles. Shown is the steady-state profile of two models, differing only in the rate by which the morphogen is produced. In both models, the morphogen degrades linearly, with the same degradation rate, and diffuses with the same diffusion coefficient. The perturbed profile (green line) corresponds to morphogen that is produced at half the rate by which wild-type morphogen is produced (black line). The profiles are shown in linear scale (A) and log scale (B). The red arrow denotes the shift in profile. (C–D) The two steady-state morphogen profiles are related through a shift in the position coordinates. The perturbed profile is plotted in a new coordinate frame, obtained by shifting the original coordinates along the x-axis (defining new_x = old_x + Δ, with Δ as some fixed value). In these coordinates, the perturbed profile coincides with the wild-type profile (dashed gray line, plotted in the original coordinate system). The profiles are shown in linear scale (C) and log scale (D).
Figure 2.
Figure 2.
Pre-steady-state decoding. (A, B) Temporal evolution of morphogen profile: The morphogen profiles at different time points, as indicated, are shown using either absolute levels (A) or normalized by their maximum at x = 0 (B). The morphogen degrades linearly at a rate f = τ−1. Morphogen production began at time t = 0. Time is in units of morphogen degradation time τ. (C, D) Change in morphogen profile following reduction in production rate: The wild-type morphogen profile is compared with a perturbed profile, corresponding to morphogen that is produced twofold slower. δx denotes the shift between the wild-type and the perturbed profiles. Note the uniform shift for the steady-state profile (C), compared with the position-dependent shift for the pre-steady-state profile (D), where the shift decreases further away from the morphogen source. (E, F) Shifts in morphogen profile following reduction in production rate: Shown are the shifts in threshold positions following twofold reduction (E) or enhancement (F) in morphogen-production rate. The shifts are shown as a function of the position of the threshold in the unperturbed system, with the different lines corresponding to different pre-steady-state profiles, obtained following the initiation of morphogen production, at the indicated times. Symbols correspond to simulation of the full gap-gene system, as described in Bergmann et al. 2007.
Figure 3.
Figure 3.
Shuttling versus inhibition-based mechanism for gradient formation. (A) Canonical model for morphogen gradient formation: Morphogen is produced from a local source. Diffusion and degradation of the morphogen across the field leads to a concentration gradient that picks at the source and decays away from it. (B) Noncanonical model for morphogen gradient formation: Morphogen is produced in a broad domain but its activity is subsequently restricted to a narrow area that is well within its domain of expression. Restricted activity could be because of, e.g., an inhibitor secreted from the adjacent domains. (C) Inhibition-based patterning mechanism: A schematic representation of the inhibition-based mechanism. An inhibition gradient is generated through the localized secretion of an inhibitor and its degradation by a uniform protease. This inhibition gradient is established over a field of an activator. The activator may be uniformly distributed. Note that positive feedback of BMP expression may eventually result in graded BMP expression as well, but this is not required for the generation of the gradient itself, and does not constitute a main aspect of the patterning mechanism. The figure is based on the paradigm of early Xenopus patterning, with D, L, and V standing for dorsal, lateral, and ventral regions of the embryo, respectively. Inhibitor is shown in gray, activator in black, and the total activator (free and in complex with the inhibitor) in dashed black. (D) Shuttling-based patterning mechanism: A schematic representation of the shuttling-based mechanism. Patterning here relies mostly on the physical translocation of the BMP ligands to the ventral region. The activation gradient thus arises primarily from the graded distribution of the BMP ligands themselves. Effective shuttling requires that the binding of ligand to the inhibitor greatly facilitates its diffusion, and that the free ligand is released by cleavage of the complex. Notations are the same as those in A. (E) Inhibition-based profile does not scale: Shown is a typical profile of BMP activation within the inhibition-based model. The profile was solved twice: first for parameters simulating wild-type embryos and second for dorsal-half embryos (same parameters, but embryo’s size halved). The profiles are shown in scaled coordinates. Note the different profiles corresponding to the wild-type versus half embryo. (F) Scaling of shuttling-based profile: A typical profile of BMP activation within the shuttling-based model. The profile was solved twice: First for parameters simulating wild-type embryos and second for dorsal-half embryos (same parameters, but embryo’s size halved). The profiles are shown in scaled coordinates. Note the accurate scaling of the profiles corresponding to the wild-type versus half embryo. (GI) Robustness of shuttling-based mechanism. (G) Inhibitor profile is not robust: The profile of the inhibitor is not robust to dosage of the inhibitor or the protease. In fact, changing the inhibitor dosage causes a proportional change in its spatial profile, as is shown in the figure. (H) Robustness of the activation profile to the levels of inhibitor: The activation profile is robust to changes in inhibitor or protease because of the fact that the level of inhibitor-activator complex, which is uniform throughout the field and functions as a global integrator, is also altered in proportion to the change in the inhibitor dosage. Because the free activator does not diffuse, its level at any point in space is given by the ratio between the complex and free inhibitor, which is independent of the inhibitor or protease dosages. (I) Robustness of the activation profile to the levels of activator: The activation profile is also robust to the total level of activator. This, again, is because of the fact that the free activator does not diffuse. Lack of diffusion allows the storage of any excess activator in the dorsal-most region, where no inhibitor is present.
Figure 4.
Figure 4.
Generating threshold responses by zero-order ultrasensitivity. (A) In a wild-type embryo (stage 10), the activating ligand Spi emanates from the ventral midline (arrowhead), triggering EGF receptor in the adjacent cells, and leading to graded activation of MAP kinase that is detected with dpERK antibodies (red). (B) Within the domain of MAP kinase activation (dashed white line), the degradation pattern of Yan (green, full line) at the same stage shows a much more restricted and sharp response. (C) A classical zero-order hypersensitivity model, showing the reversible conversion of a substrate between two states, and the dependence of the final product only on the difference between the rate of opposing enzymatic reactions. (D) In the case of the Yan degradation network, in addition to phosphorylation by MAP kinase (MAPK) and dephosphorylation by unknown proteases, aspects such as synthesis and degradation have to be considered. Similar to the classical model, a switchlike behavior is generated when the substrate is in excess with respect to the dissociation constants for the two opposing enzymes.

Similar articles

Cited by

References

    1. Akiyama T, Kamimura K, Firkus C, Takeo S, Shimmi O, Nakato H 2008. Dally regulates Dpp morphogen gradient formation by stabilizing Dpp on the cell surface. Dev Biol 313:408–419 - PMC - PubMed
    1. Barkai N, Ben-Zvi D 2009. ‘Big frog, small frog’–maintaining proportions in embryonic development: Delivered on 2 July 2008 at the 33rd FEBS Congress in Athens, Greece. FEBS J 276:1196–1207 - PubMed
    1. Ben-Zvi D, Shilo BZ, Fainsod A, Barkai N 2008. Scaling of the BMP activation gradient in Xenopus embryos. Nature 453:1205–1211 - PubMed
    1. Bergmann S, Sandler O, Sberro H, Shnider S, Schejter E, Shilo BZ, Barkai N 2007. Pre-steady-state decoding of the Bicoid morphogen gradient. PLoS Biol 5:e46. - PMC - PubMed
    1. Bergmann S, Tamari Z, Schejter E, Shilo BZ, Barkai N 2008. Re-examining the stability of the Bicoid morphogen gradient. Cell 132:15–17; author reply 17–18 - PubMed

Publication types

LinkOut - more resources