

GSMA: Gene Set Matrix Analysis, An Automated Method for Rapid Hypothesis Testing of Gene Expression Data
- PMID: 20066124
- PMCID: PMC2789691
GSMA: Gene Set Matrix Analysis, An Automated Method for Rapid Hypothesis Testing of Gene Expression Data
Abstract
Background: Microarray technology has become highly valuable for identifying complex global changes in gene expression patterns. The assignment of functional information to these complex patterns remains a challenging task in effectively interpreting data and correlating results from across experiments, projects and laboratories. Methods which allow the rapid and robust evaluation of multiple functional hypotheses increase the power of individual researchers to data mine gene expression data more efficiently.
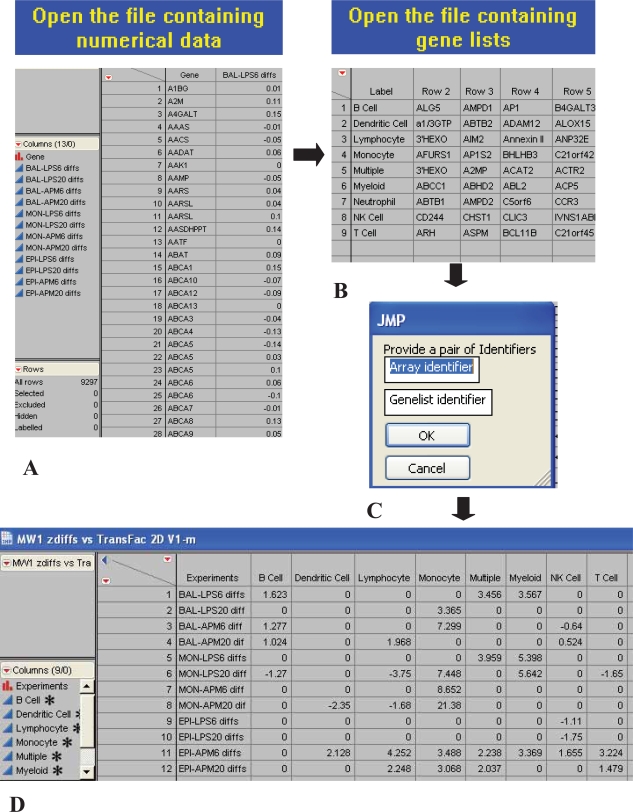
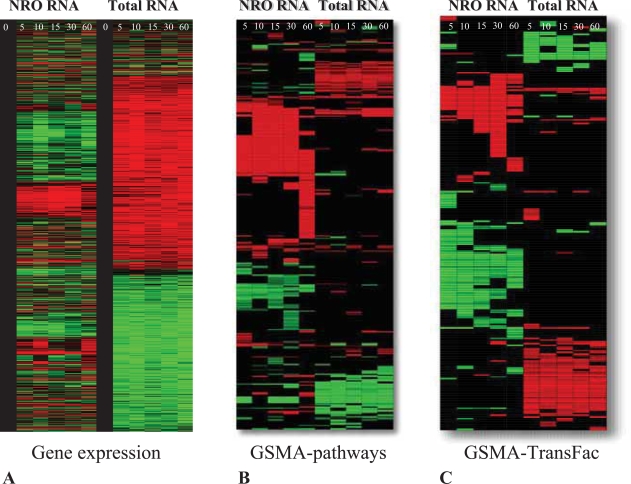
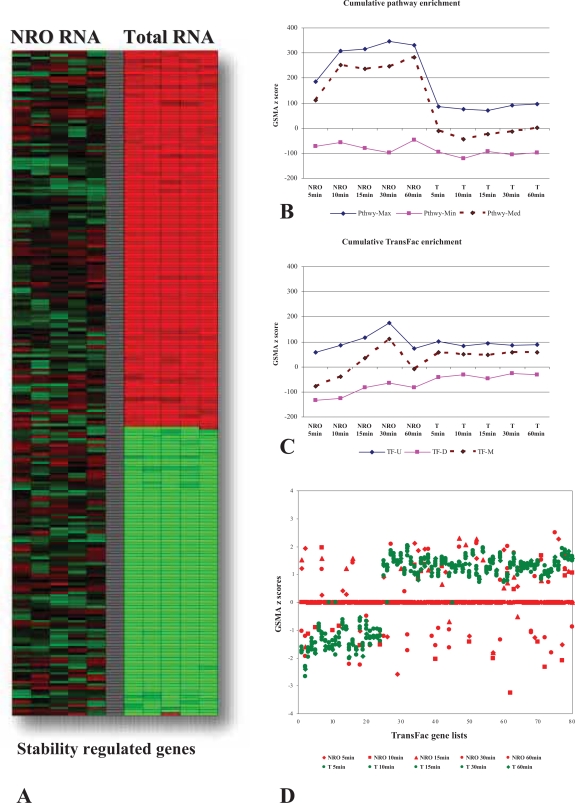
Results: We have developed (gene set matrix analysis) GSMA as a useful method for the rapid testing of group-wise up- or down-regulation of gene expression simultaneously for multiple lists of genes (gene sets) against entire distributions of gene expression changes (datasets) for single or multiple experiments. The utility of GSMA lies in its flexibility to rapidly poll gene sets related by known biological function or as designated solely by the end-user against large numbers of datasets simultaneously.
Conclusions: GSMA provides a simple and straightforward method for hypothesis testing in which genes are tested by groups across multiple datasets for patterns of expression enrichment.
Figures
Similar articles
-
A rapid method for microarray cross platform comparisons using gene expression signatures.Mol Cell Probes. 2007 Feb;21(1):35-46. doi: 10.1016/j.mcp.2006.07.004. Epub 2006 Aug 10. Mol Cell Probes. 2007. PMID: 16982174
-
BubbleGUM: automatic extraction of phenotype molecular signatures and comprehensive visualization of multiple Gene Set Enrichment Analyses.BMC Genomics. 2015 Oct 19;16:814. doi: 10.1186/s12864-015-2012-4. BMC Genomics. 2015. PMID: 26481321 Free PMC article.
-
Signature Evaluation Tool (SET): a Java-based tool to evaluate and visualize the sample discrimination abilities of gene expression signatures.BMC Bioinformatics. 2008 Jan 28;9:58. doi: 10.1186/1471-2105-9-58. BMC Bioinformatics. 2008. PMID: 18221568 Free PMC article.
-
Equivalent change enrichment analysis: assessing equivalent and inverse change in biological pathways between diverse experiments.BMC Genomics. 2020 Feb 24;21(1):180. doi: 10.1186/s12864-020-6589-x. BMC Genomics. 2020. PMID: 32093613 Free PMC article.
-
Retrospective analysis: reproducibility of interblastomere differences of mRNA expression in 2-cell stage mouse embryos is remarkably poor due to combinatorial mechanisms of blastomere diversification.Mol Hum Reprod. 2018 Jul 1;24(7):388-400. doi: 10.1093/molehr/gay021. Mol Hum Reprod. 2018. PMID: 29746690
Cited by
-
Hypoxia-induced mitogenic factor (HIMF/FIZZ1/RELMα) in chronic hypoxia- and antigen-mediated pulmonary vascular remodeling.Respir Res. 2013 Jan 4;14(1):1. doi: 10.1186/1465-9921-14-1. Respir Res. 2013. PMID: 23289668 Free PMC article.
-
A developmental taxonomy of glioblastoma defined and maintained by MicroRNAs.Cancer Res. 2011 May 1;71(9):3387-99. doi: 10.1158/0008-5472.CAN-10-4117. Epub 2011 Mar 8. Cancer Res. 2011. PMID: 21385897 Free PMC article.
-
Regulatory subunits of PKA define an axis of cellular proliferation/differentiation in ovarian cancer cells.BMC Med Genomics. 2008 Sep 26;1:43. doi: 10.1186/1755-8794-1-43. BMC Med Genomics. 2008. PMID: 18822129 Free PMC article.
-
PathCluster: a framework for gene set-based hierarchical clustering.Bioinformatics. 2008 Sep 1;24(17):1957-8. doi: 10.1093/bioinformatics/btn357. Epub 2008 Jul 15. Bioinformatics. 2008. PMID: 18628289 Free PMC article.
References
-
- Mootha VK, Lindgren CM, Eriksson KF, Subramanian A, Sihag S, Lehar J, Puigserver P, Carlsson E, Ridderstrale M, Laurila E, et al. PGC-1alpha-responsive genes involved in oxidative phosphorylation are coordinately downregulated in human diabetes. Nat Genet. 2003;34(3):267–73. - PubMed
-
- Sweet-Cordero A, Mukherjee S, Subramanian A, You H, Roix JJ, Ladd-Acosta C, Mesirov J, Golub TR, Jacks T. An oncogenic KRAS2 expression signature identified by cross-species gene-expression analysis. Nat Genet. 2005;37(1):48–55. - PubMed
-
- Cheadle C, Becker KG, Cho-Chung YS, Nesterova M, Watkins T, Wood W, 3rd, Prabhu V, Barnes KC. A rapid method for microarray cross platform comparisons using gene expression signatures. Mol Cell Probes 2006 - PubMed
-
- Cho RJ, Huang M, Campbell MJ, Dong H, Steinmetz L, Sapinoso L, Hampton G, Elledge SJ, Davis RW, Lockhart DJ. Transcriptional regulation and function during the human cell cycle. Nat. Genet. 2001;27(1):48–54. - PubMed
-
- Falcon S, Gentleman R. Using GOstats to test gene lists for GO term association. Bioinformatics. 2007;23(2):257–8. - PubMed
LinkOut - more resources
Full Text Sources