Review
. 2010 Jan 21;8(2):305-20.
doi: 10.1039/b915870g. Epub 2009 Nov 5.

Glycosidase inhibition: assessing mimicry of the transition state

Affiliations
Review

Glycosidase inhibition: assessing mimicry of the transition state

Tracey M Gloster et al. Org Biomol Chem. .

Abstract

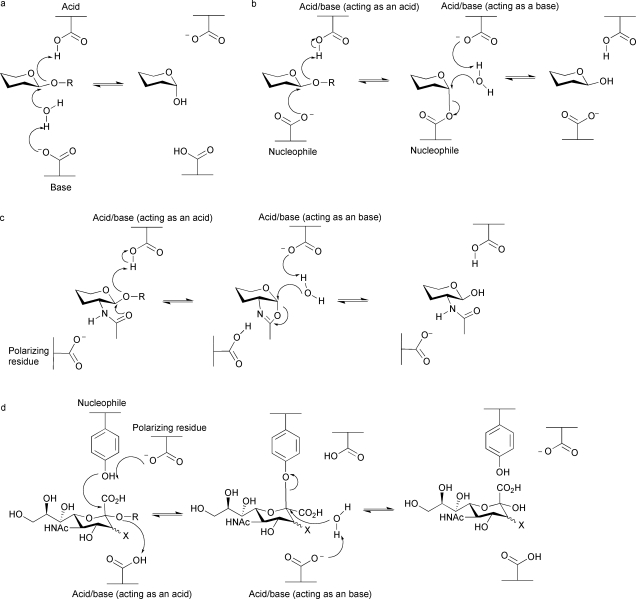
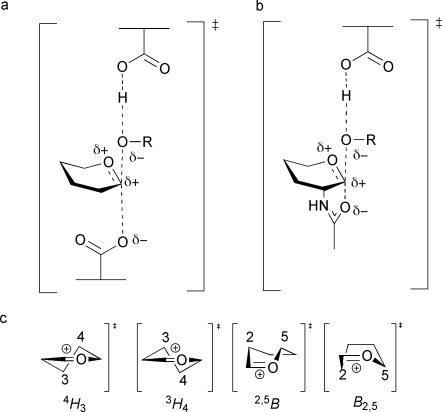
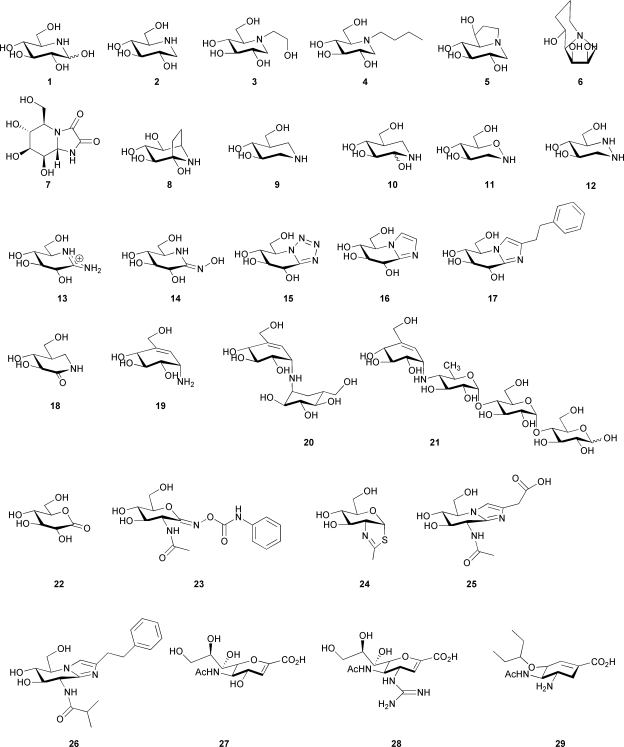
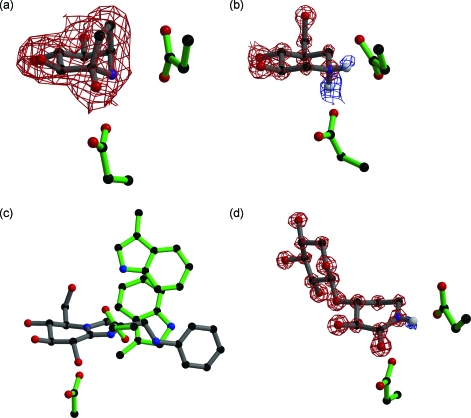
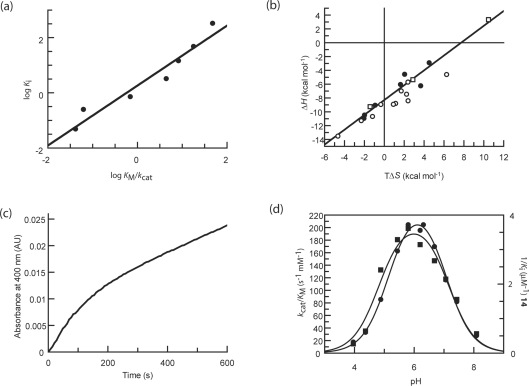
Glycoside hydrolases, the enzymes responsible for hydrolysis of the glycosidic bond in di-, oligo- and polysaccharides, and glycoconjugates, are ubiquitous in Nature and fundamental to existence. The extreme stability of the glycosidic bond has meant these enzymes have evolved into highly proficient catalysts, with an estimated 10(17) fold rate enhancement over the uncatalysed reaction. Such rate enhancements mean that enzymes bind the substrate at the transition state with extraordinary affinity; the dissociation constant for the transition state is predicted to be 10(-22) M. Inhibition of glycoside hydrolases has widespread application in the treatment of viral infections, such as influenza and HIV, lysosomal storage disorders, cancer and diabetes. If inhibitors are designed to mimic the transition state, it should be possible to harness some of the transition state affinity, resulting in highly potent and specific drugs. Here we examine a number of glycosidase inhibitors which have been developed over the past half century, either by Nature or synthetically by man. A number of criteria have been proposed to ascertain which of these inhibitors are true transition state mimics, but these features have only be critically investigated in a very few cases.


Figures

None
Tracey M. Gloster
None
Gideon J. Davies
Fig. 1
Fig. 1. Glycosidase mechanisms for hydrolysis. (a) ‘Classical’ mechanism for inversion of stereochemistry. (b) ‘Classical’ mechanism for retention of stereochemistry. (c) Substrate-assisted mechanism proposed for families 18, 20, 56, 84, 85 and possibly 25. (d) Mechanism using a tyrosine residue as the nucleophile proposed for families 33 and 34.
Fig. 2
Fig. 2. Structure of the oxocarbenium ion-like transition state, formed during glycoside hydrolysis of (a) the glycosylation step of the ‘classical’ retaining mechanism and (b) the glycosylation step of substrate-assisted catalysis; R is the leaving group. (c) Possible transition state conformations employed during glycoside hydrolysis (half chair (4 H 3 or 3 H 4) or boat (2,5 B or B 2,5) conformations).
Fig. 3
Fig. 3. Structure of nojirimycin (1), deoxynojirimycin (2), Miglitol (3), N-butyl deoxynojirimycin (4), castanospermine (5), swainsonine (6), kifunensine (7), calystegine B 2 (8), isofagomine (9), noeuromycin (10), tetrahydrooxazine (11), azafagomine (12), gluco-amidine (13), gluco-hydroximolactam (14), glucotetrazole (15), unsubstituted glucoimidazole (16), phenethyl-substituted glucoimidazole (17), isofagomine lactam (18), valienamine (19), validoxylamine A (20), acarbose (21), gluconolactone (22), PUGNAc (23), NAG-thiazoline (24), gluco-nagstatin (25), GlcNAcstatin C (26), 2-deoxy-2,3-didehydro-N-acetylneuraminic acid (27), Relenza (28), and Tamiflu (29).
Fig. 4
Fig. 4. (a) Calystegine (8) in complex with a family 1 β-glucosidase (PDB code ; 2CBV); the residue below the inhibitor is the catalytic nucleophile and the residue to the right is the acid/base. Observed electron density (for the maximum likelihood weighted 2F obsF calc map, contoured at 1σ) is shown for calystegine, showing it binds in a similar orientation to isofagomine. (b) Cellobio-derived form of isofagomine (9) in complex with a family 5 endoglucanase (PDB code ; 1OCQ); the residue below the inhibitor is the catalytic nucleophile and the residue to the right is the acid/base. Observed electron density for the maximum likelihood weighted 2F obsF calc map, contoured at 2.5σ, is shown in red and for the F obsF calc map, contoured at 2.1σ, is shown in blue. The ‘difference’ density shows the presence of two hydrogen atoms on the nitrogen atom of isofagomine. (c) Phenylaminomethyl-substituted glucoimidazole in complex with a family 3 β-d-glucan glucohydrolase (PDB code ; 1X39); the residue below the inhibitor is the catalytic nucleophile and the residue to the right is the acid/base. The two tryptophan residues in the active site are proposed to make hydrophobic interactions with the phenyl ring of the inhibitor, but this interaction has not been observed in all enzyme complexes with substituted imidazole inhibitors. (d) Xylobio-derived isofagomine lactam in complex with a family 10 xylanase (PDB code ; 1OD8); the residue below the inhibitor is the catalytic nucleophile and the residue to the right is the acid/base. Observed electron density for the maximum likelihood weighted 2F obsF calc map, contoured at 4σ, is shown in red and for the F obsF calc map, contoured at 1.8σ, is shown in blue. The ‘difference’ density shows the presence of a hydrogen atom on the nitrogen atom of the isofagomine lactam, indicating it exists as the amide tautomer and not the iminol as originally proposed.
Fig. 5
Fig. 5. (a) Linear free energy plot of log K i against log K M/k cat for the phenethyl-substituted mannoimidazole with the family 2 β-mannosidase (data taken from Ref. 134). The best fit line through the points has a slope of 1.09 and a correlation r 2 of 0.94, which strongly suggests the compound is a good mimic of the transition state. (b) Enthalpy–entropy compensation plot for inhibitors with a β-glucosidase; the line of best fit has a slope of 0.93 and correlation of 0.91. Points in circles represent data from the initial study of 18 compounds (data taken from Ref. 184); filled circles represent those which mimic the charge at the transition state, open circles those which mimic the geometry. The points in squares represent data from subsequent studies (data taken from Ref. 194 and 195) and demonstrate that even when a compound is enthalpically unfavourable, it still falls on the line. (c) Plot of gain of product (as indicated by an increase in absorbance at 400 nm by production of 2,4-dinitrophenolate from hydrolysis of 2,4-dinitrophenyl β-d-glucopyranoside by a β-glucosidase) against time to illustrate slow onset inhibition. Slow onset inhibition is characterised by an initial rapid catalytic rate (here for 200–300 s), followed by a slower steady state rate. (d) pH dependence of k cat/K M for a β-glucosidase (circles) and 1/K i for 14 (squares); fits to bell-shaped ionisation profiles are shown (data taken from Ref. 184). In this case the pH dependence for inhibition mirrors that of catalysis, but this is not the case for all inhibitors.

References

    1. Davies G. J., Gloster T. M., Henrissat B. Curr. Opin. Struct. Biol. 2005;15:637–645. - PubMed
    1. Laine R. A. Glycobiology. 1994;4:759–767. - PubMed
    1. Wolfenden R., Lu X., Young G. J. Am. Chem. Soc. 1998;120:6814–6815.
    1. Suzuki Y., Ichinomiya S., Kurosawa M., Ohkubo M., Watanabe H., Iwasaki H., Matsuda J., Noguchi Y., Takimoto K., Itoh M., Tabe M., Iida M., Kubo T., Ogawa S., Nanbe E., Higaki K., Ohno K., Brady R. O. Ann. Neurol. 2007;62:671–675. - PubMed
    1. Sawkar A. R., Cheng W.-C., Beutler E., Wong C.-H., Balch W. E., Kelly J. W. Proc. Natl. Acad. Sci. U. S. A. 2002;99:15428–15433. - PMC - PubMed

Publication types

MeSH terms