. 2010 Nov;124(1):121-31.
doi: 10.1007/s10549-009-0715-4. Epub 2010 Jan 12.

Anti-HER2 immunoliposomes for selective delivery of electron paramagnetic resonance imaging probes to HER2-overexpressing breast tumor cells

Affiliations

Anti-HER2 immunoliposomes for selective delivery of electron paramagnetic resonance imaging probes to HER2-overexpressing breast tumor cells

Scott R Burks et al. Breast Cancer Res Treat. 2010 Nov.

Abstract

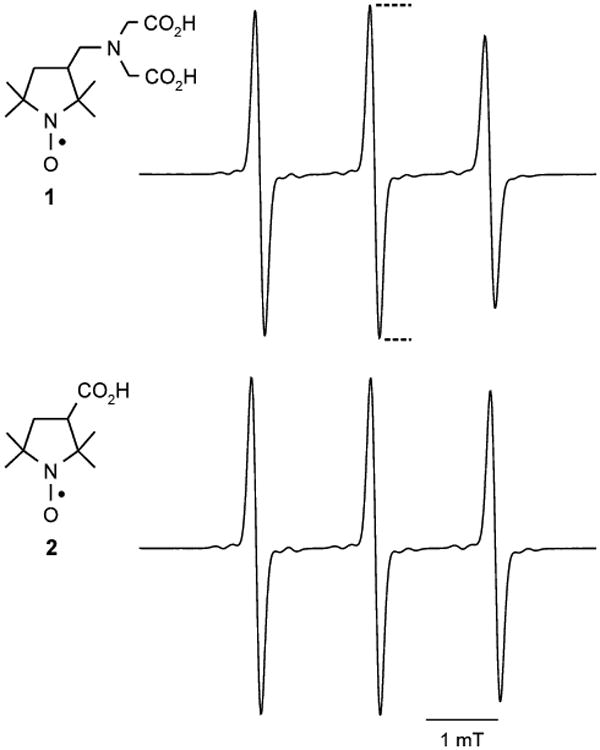
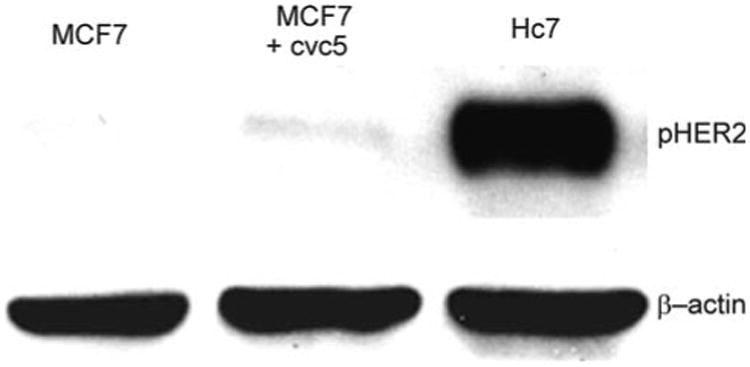
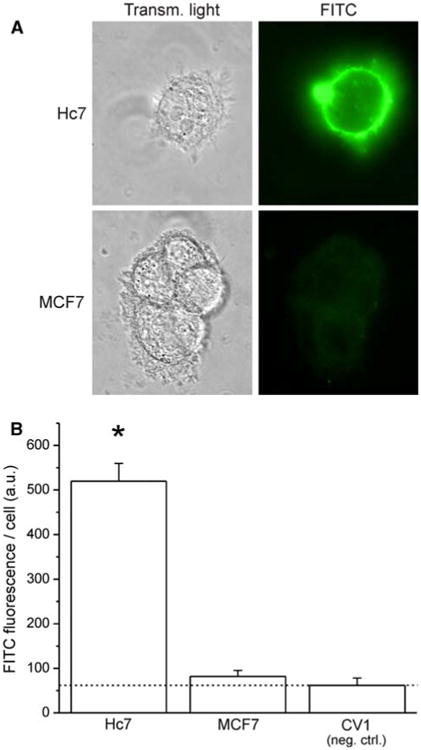
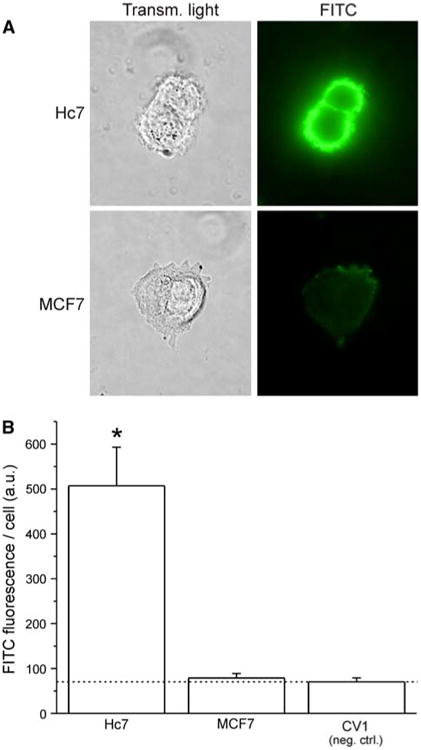
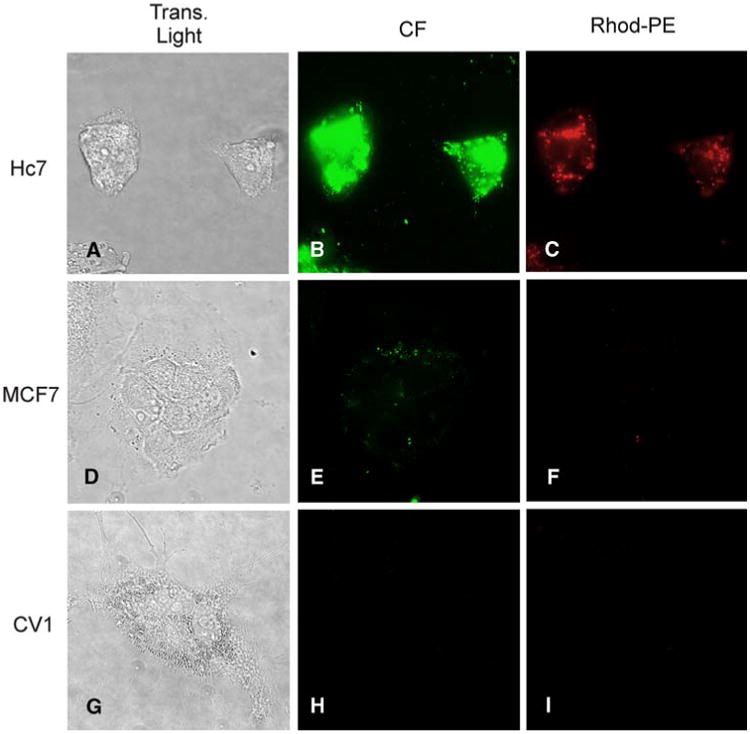
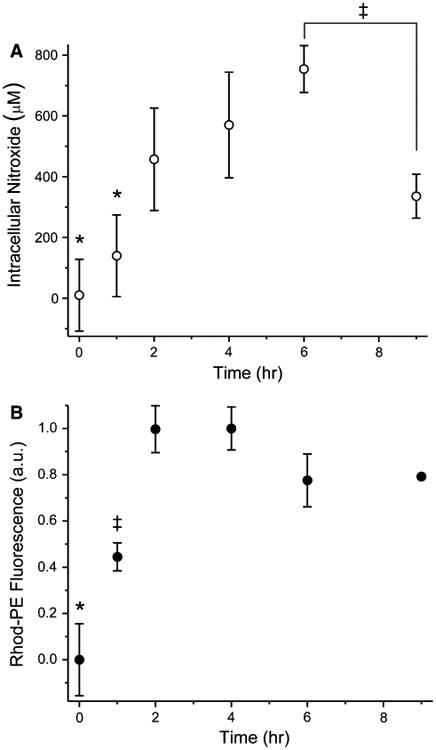
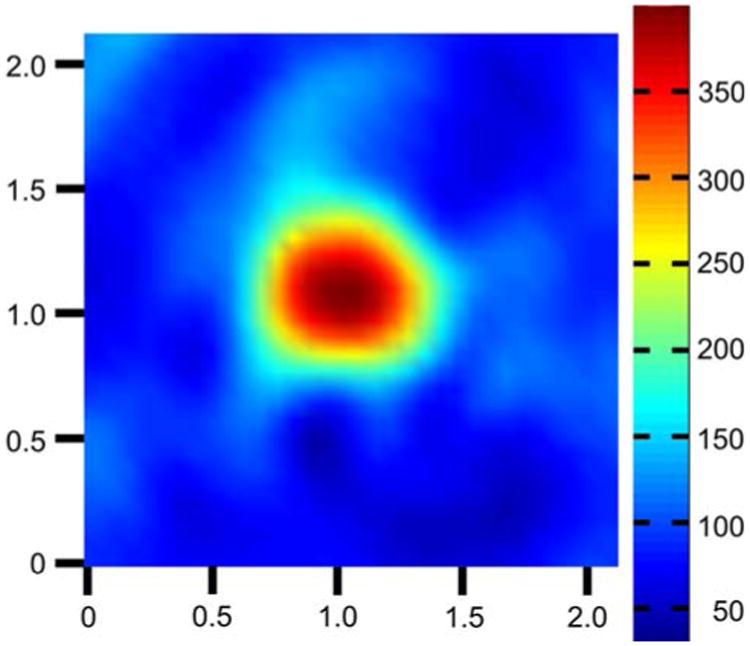
Electron paramagnetic resonance (EPR) imaging is an emerging modality that can detect and localize paramagnetic molecular probes (so-called spin probes) in vivo. We previously demonstrated that nitroxide spin probes can be encapsulated in liposomes at concentrations exceeding 100 mM, at which nitroxides exhibit a concentration-dependent quenching of their EPR signal that is analogous to the self-quenching of fluorescent molecules. Therefore, intact liposomes encapsulating high concentrations of nitroxides exhibit greatly attenuated EPR spectral signals, and endocytosis of such liposomes represents a cell-activated contrast-generating mechanism. After endocytosis, the encapsulated nitroxide is liberated and becomes greatly diluted in the intracellular milieu. This dequenches the nitroxides to generate a robust intracellular EPR signal. It is therefore possible to deliver a high concentration of nitroxides to cells while minimizing background signal from unendocytosed liposomes. We report here that intracellular EPR signal can be selectively generated in a specific cell type by exploiting its expression of Human Epidermal Growth Factor Receptor 2 (HER2). When targeted by anti-HER2 immunoliposomes encapsulating quenched nitroxides, Hc7 cells, which are novel HER2-overexpressing cells derived from the MCF7 breast tumor cell line, endocytose the liposomes copiously, in contrast to the parent MCF7 cells or control CV1 cells, which do not express HER2. HER2-dependent liposomal delivery enables Hc7 cells to accumulate 750 μM nitroxide intracellularly. Through the use of phantom models, we verify that this concentration of nitroxides is more than sufficient for EPR imaging, thus laying the foundation for using EPR imaging to visualize HER2-overexpressing Hc7 tumors in animals.


Figures

Fig. 1
Fig. 1
Structures and EPR spectra of nitroxides. The structures of nitroxides 1 and 2 are shown at left. The corresponding 3-line EPR spectra, acquired at the same nitroxide concentration, are shown at right (experimental details in “Materials and methods”). Reported EPR spectral intensity is the height of the center peak, as indicated by the dotted lines
Fig. 2
Fig. 2
Western blots for HER2. Top row: Hc7 cell lysates show high expression of phospho-HER2 when compared to untransfected MCF7 cells or MCF7 cells transfected with the cvc5 vector, which lacks HER2 DNA. Bottom row: β-actin staining as loading control
Fig. 3
Fig. 3
Immunostaining for plasma-membrane-localized HER2. Cells were fixed with paraformaldehyde (pH 7.4) in the absence of detergents. Trastuzumab IgG was used as the primary antibody, with a human-Fab-specific, FITC-conjugated secondary antibody. a Representative transmitted-light and fluorescence images of Hc7 and MCF7 cells after immunofluorescence staining. b Quantitation of average FITC fluorescence per cell for three cell lines: Hc7, which overexpresses HER2; MCF7, which expresses physiological levels of HER2 and, as negative control, CV1, which has no HER2 expression (dotted line indicates the fluorescence of the CV1 negative control; error bars represent SEM; ANOVA: F2,36 = 75.97)
Fig. 4
Fig. 4
Trastuzumab Fab′ fragments retain immunoreactivity with HER2. Primary staining was done with maleimide-inactivated trastuzumab Fab′ fragments using the same protocol in Fig 2. a Representative transmitted-light and fluorescence images of Hc7 and MCF7 cells after immunofluorescence staining. b Quantitation of average FITC fluorescence per cell for three cell lines: Hc7, which overexpresses HER2; MCF7, which expresses physiological levels of HER2 and, as negative control, CV1, which has no HER2 expression (dotted line indicates the fluorescence of the CV1 negative control; error bars represent SEM; ANOVA: F2,38 = 31.38)
Fig. 5
Fig. 5
Incubation with anti-HER2 immunoliposomes containing Rhod-PE and encapsulating carboxyfluorescein (CF) generates bright intracellular signals in Hc7 cells, but not MCF7 or CV1 cells. Panels a, d, and g are transmitted light images; panels b, e, and h show fluorescence in the fluorescein channel; panels c, f, and i show fluorescence in the rhodamine channel. HER2-overexpressing Hc7 cells (a–c) avidly endocytose immunoliposomes, as evidenced by the intense red fluorescence of Rhod-PE (c). Endocytosis results in dequenching of CF to generate bright intracellular green fluorescence (b). MCF7 cells (d–f) express a physiological level of HER2 and endocytose fewer liposomes, giving rise to only feeble fluorescence. CV1 cells (g–i), which express no HER2, exhibit no fluorescence
Fig. 6
Fig. 6
Hc7 cellular uptake of Rhod-PE-containing immunoliposomes encapsulating nitroxide. Dishes of Hc7 cells were incubated at 37°C with immunoliposomes containing Rhod-PE and loaded with nitroxide 1. At various times, intracellular nitroxide (a) and Rhod-PE (b) were assayed spectroscopically (n = 3). By 6 h, intracellular nitroxide had increased to ∼750 μM through immunoliposomal endocytosis, as verified by parallel uptake of liposomal Rhod-PE. Beyond 6 h, endocytosis slowed markedly (evidenced by lack of further Rhod-PE accumulation) and intracellular nitroxide signal declined (error bars represent SD; where not seen, the bar was smaller than the symbol). Statistical significance (P < 0.05) is denoted by asterisks and double-daggers. ANOVA values: panel a, F5,17 = 11.49; panel b, F5,17 = 53.79
Fig. 7
Fig. 7
EPR image of nitroxide-impregnated agarose phantom. End view of an agarose cylinder containing 100 μM nitroxide 2. The cylinder is 6 mm in diameter and 3 mm in length. Cross-sectional view shown is from the approximate center of the cylinder's axial dimension. The known geometry of the cylinder is well represented in the image. Signal from the cylinder is imaged with a signal-to-noise ratio of 79 and a spatial resolution of 4.4 mm. All axis labels are in centimeters and spectral intensity is encoded according to the scale shown on the right

Similar articles

Cited by

References

    1. Alix-Panabieres C, Muller V, Pantel K. Current status in human breast cancer micrometastasis. Curr Opin Oncol. 2007;19:558–563. doi: 10.1097/CCO.0b013e3282f0ad79. - DOI - PubMed
    1. Park D, Karesen R, Naume B, et al. The prognostic impact of occult nodal metastasis in early breast carcinoma. Breast Cancer Res Treat. 2009 doi: 10.1007/s10549-009-0340-2. - DOI - PubMed
    1. Naumov GN, Townson JL, MacDonald IC, et al. Ineffectiveness of doxorubicin treatment on solitary dormant mammary carcinoma cells or late-developing metastases. Breast Cancer Res Treat. 2003;82:199–206. doi: 10.1023/B:BREA.0000004377.12288.3c. - DOI - PubMed
    1. Halpern HJ, Spencer DP, Vanpolen J, et al. Imaging radio-frequency electron-spin-resonance spectrometer with high-resolution and sensitivity for in vivo measurements. Rev Sci Instrum. 1989;60:1040–1050.
    1. Carrington A, McLachlan A. Introduction to magnetic resonance. Harper & Row; New York: 1967. pp. 1–4.

Publication types

MeSH terms