. 2010 Jan:Chapter 2:Unit2.1.
doi: 10.1002/0471142301.ns0201s50.

Fluorescence microscopy: a concise guide to current imaging methods

Affiliations

Fluorescence microscopy: a concise guide to current imaging methods

Christian A Combs. Curr Protoc Neurosci. 2010 Jan.

Abstract

The field of fluorescence microscopy is rapidly growing, providing ever increasing imaging capabilities for cell and neurobiologists. Over the last decade, many new technologies and techniques have been developed which allow for deeper, faster, or higher resolution imaging. For the non-expert microscopist, it can be difficult to match the best imaging technique to the biological question to be examined. Picking the right technique requires a basic understanding of the underlying imaging physics for each technique, as well as an informed comparison and balancing of competing imaging properties in the context of the sample to be imaged. This unit provides concise descriptions of a range of commercially available imaging techniques and provides a tabular guide to choosing among them. Techniques covered include structured light, confocal, total internal reflection fluorescence (TIRF), two-photon, and stimulated emission depletion (STED) microscopy.


Figures
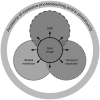
Figure 1
Figure 1
Diagram of some of the critical opposing factors in an imaging experiment. The best image is one that can balance these factors to obtain the necessary information while avoiding photobleaching or phototoxic effects. Table 1 outlines how these factors differ between the various commercialized microscopy techniques discussed in this work.
Figure 2
Figure 2
The basic principles of structured light microscopy are shown in panels A,B, and C. If an unknown pattern (such as a biological sample) represented in (A) is multiplied by a known regular illumination pattern (B) then a beat pattern (moiré fringes) will appear (C). The pattern is the difference between the sample and the regular illumination pattern and is course enough to be seen through the microscope even if the original pattern in the sample was not resolvable. By moving the grid and the sample in space and computationally processing the resulting data an image can be generated that has resolution at least 2× better than a conventional wide-field image. D and F. Confocal and structured light images respectively of the edge of a Hela cell showing the actin cytoskeleton. E and G show enlargements of the images in D and F. The apparent fiber diameters are 110-120nm in the structured light images compared to 280 to 300nm in the confocal image. Figure A, B, and C are reproduced with permission from (Gustafsson, 2005) . Figures D and E are reproduced with permission from (Gustafsson, 2000). Panels A-E were originally published in color and have been altered here to black and white.
Figure 3
Figure 3
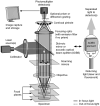
Basic architecture of a modern confocal microscope. Excitation light from laser is passed through the various collimating optics in a scan-head to either a variable dichroic mirror (Nikon, Zeiss, or Olympus) or an AOBS (Acousto-Optical Beam Splitter) (Leica) where it is reflected through the objective and focused to a point on the sample. Moveable mirrors in the scan-head before the objective scan the excitation beam over the sample, a point at a time, to build the image. Fluorescence emission light passes back through the objective, through the dichroic or AOBS to the light sensing PMT(s) (photo-multiplier tube). An aperture (pinhole) placed in the conjugate image plane to the point of focus in the sample allows only light from the focal plane to impinge on the sample and out-of-focus light is blocked. The pinhole can be made larger to allow for larger optical sectioning capability allowing more out of focus light to impinge on the PMT(s). In some models a diffraction grating or prism placed in the beam-path of the emission light can act as a variable band-pass filter or as a spectral detector if the polychromatic light is spatially spread on a number of PMTs.
Figure 4
Figure 4
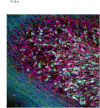
Maximum projection reconstruction from confocal images obtained through a 65 μm stack of mouse cerebellum labeled with a combination of fluorescent proteins. In the online color version of this image one can see the unique colors produced and spectrally detected by the genetic combinations of individual fluorescent proteins which the authors label as XFP's. These colors were used to trace and map the various synaptic circuits. This figure was reproduced with permission from (Livet et al., 2007). This figure was originally published in color, and can be seen online in color, but has been altered for the print version of this article in black and white.
Figure 4
Figure 4
Maximum projection reconstruction from confocal images obtained through a 65 μm stack of mouse cerebellum labeled with a combination of fluorescent proteins. In the online color version of this image one can see the unique colors produced and spectrally detected by the genetic combinations of individual fluorescent proteins which the authors label as XFP's. These colors were used to trace and map the various synaptic circuits. This figure was reproduced with permission from (Livet et al., 2007). This figure was originally published in color, and can be seen online in color, but has been altered for the print version of this article in black and white.
Figure 5
Figure 5
TIRF microscopy excites a shallow region above the coverslip using oblique laser excitation which is totally internally reflected and produces an evanescent wave for fluorophore excitation. A. Internal reflection. Light propagating through the periphery of a high numerical aperture objective (>1.38) is totally internally reflected by the coverslip and sent down the opposing side of the objective. B. Evanescent wave is formed when the critical angle θC is reached and the light is the totally reflected. The reflection at the coverslip is due to the oblique angle of illumination and the mismatch of refraction index (n) between the oil and coverslip. Note that the evanescent wave only excites fluorophores where the cell attaches or is touching the coverslip. C and D (no D indicated) show a wide-field and TIRF image, respectively, of GFP tagged myosin V from Drosophila embryo hemocytes. Comparing the two images it is evident where the Myosin 5 is closest to the coverslip particularly in the bottom cell. Hemocytes courtesy of Amy Hong, NHLBI, NIH. Figure B was reproduced with permission from Mike Davidson (Florida State University and the National High Magnetic Field Laboratory) and the Molecular Expressions website.
Figure 6
Figure 6
Principals of two-photon fluorescence microscopy (TPFM). A shows a regular one-photon (e.g. confocal) and TPFM energy transitions in a Jablonski diagram. In TPFM two photons are absorbed nearly simultaneously to produce twice the energy. In this example GFP is excited with 960 nm light for TPFM and 488nm higher energy light for a confocal experiment. The emission is the same for both cases. It should be noted that TPFM absorption spectra for most fluorophores, including GFP, are very broad (in some cases hundreds of nanometers), and that the maximum is roughly a little less than twice the one-photon absorption maxima. B Two-photon fluorescence is generated in only one plane when a laser pulse train propagating through an objective is focused to a spot. Fluorescence is generated only at the point where the maximal photon crowding occurs and falls off from this plane at a rate of the fourth power from the center of the focal spot. C In vivo TPFM image of a mouse neocortex genetically labelled with a chloride indicator. This image shows the remarkable depth to which TPFM imaging is possible. Figure C is reproduced with permission from (Helmchen and Denk, 2005).
Figure 7
Figure 7
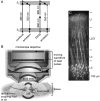
Technical principals of Stimulated Emission Depletion (STED) microscopy. A. The combination of the normal excitation beam with the phase modulated STED beam produces a sub-diffraction emission spot. The images on the right in (A) show the doughnut pattern produced by the phase modulation of the STED beam. This beam when overlapped with the diffraction-limited excitation spot quenches emission where the beams overlap leaving the middle, sub-diffraction sized, spot for spontaneous fluorescence. B. Comparison of confocal (left) and STED (right) images reveals a marked increase in resolution by STED since more labeled particles are visualized. Scale bar, 500 nm. Figure reproduced with permission from (Willig et al., 2006b).

Similar articles

Cited by

References

    1. Boccacci P, Bertero M. Image-restoration methods: basics and algorithms. In: Diaspro A, editor. Confocal and Two-Photon Microscopy: Foundations, Applications, and Advances. Wiley-Liss; New York: 2002. pp. 253–269.
    1. Coling D, Kachar B. Theory and application of fluorescence microscopy. Curr Protoc Neurosci. 1997;Chapter 2:1. Unit 2. - PubMed
    1. Diaspro A, et al. Multi-photon excitation microscopy. Biomed Eng Online. 2006;5:36. - PMC - PubMed
    1. Eisenstein M. Helping cells to tell a colorful tale. Nat Methods. 2006;3:647–655.
    1. Gustafsson MG. Surpassing the lateral resolution limit by a factor of two using structured illumination microscopy. J Microsc. 2000;198:82–7. - PubMed

Publication types

MeSH terms

LinkOut - more resources