

doi: 10.1021/cr800399g.
Formaldehyde in the indoor environment
Affiliations
- PMID: 20067232
- PMCID: PMC2855181
- DOI: 10.1021/cr800399g
Item in Clipboard
Formaldehyde in the indoor environment
Chem Rev.
.
Free PMC article
No abstract available
Figures
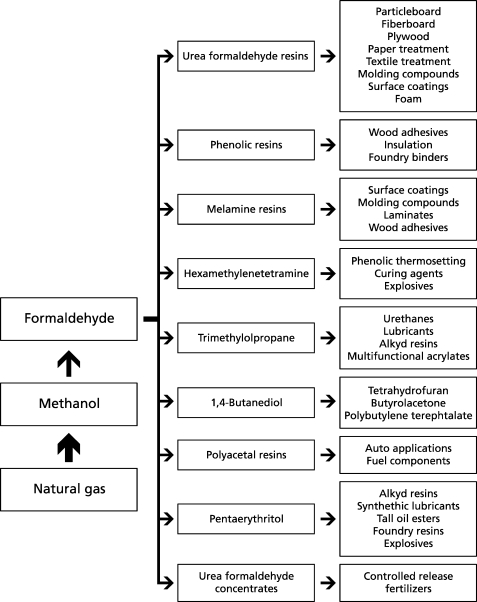
Survey of industrial applications for formaldehyde and formaldehyde products.
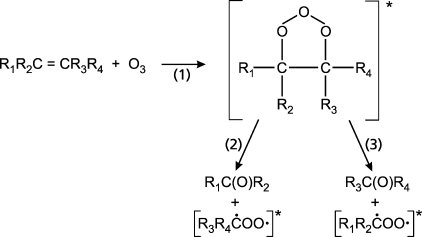
Formation of carbonyl compounds from alkene−ozone reactions.,
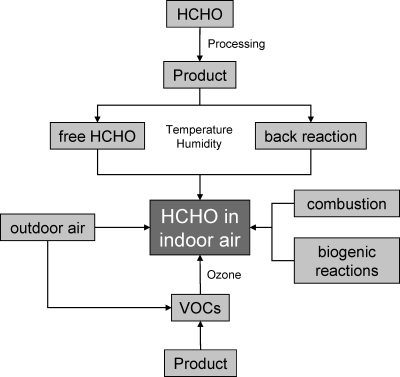
Possible indoor- and outdoor-related formaldehyde sources.
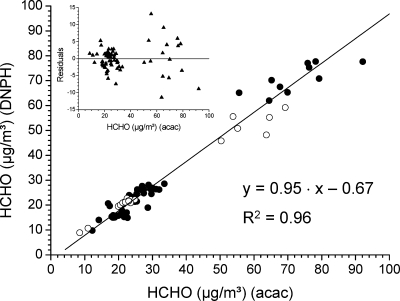
Linear relationship between formaldehyde concentrations in a test house measured by the acac and the DNPH methods for 78 data points. The inset shows the unweighted residuals plotted (reprinted from ref (154) with permission from Elsevier).
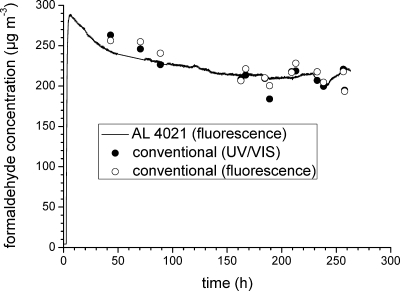
Formaldehyde emission from a MDF board in a 1 m3 chamber at T = 23 °C, r.h. = 45%, n = 1 h−1, and L = 1 m2 m−3. Solid line, online detection using an AL-4021 formaldehyde analyzer; solid circles (●), conventional acac method with UV/vis detection; open circles (○), conventional acac method with fluorescence detection.
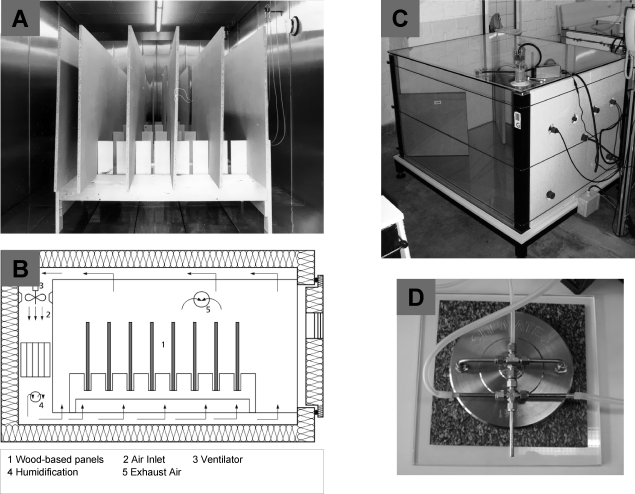
Different devices for measuring formaldehyde emission from building products under indoor-related conditions. (A) 48 m3 stainless steel chamber with particle board; (B) diagram of the 48 m3 stainless steel chamber; (C) 1 m3 glass chamber with particle board; (D) field and laboratory emission cell (FLEC) with floor covering.
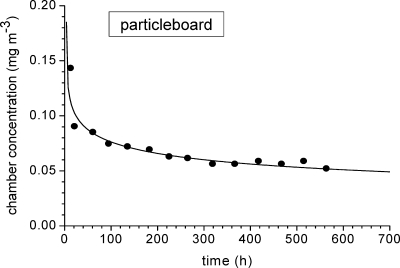
Formaldehyde emission from particle board in a large chamber (48 m3) at T = 23 °C, r.h. = 45%, n = 1 h−1, and L = 1 m2 m−3. The interpolation curve was obtained from nonlinear regression analysis using eq 16 with A = 1.18, B = 4.76, and D = 0.29.
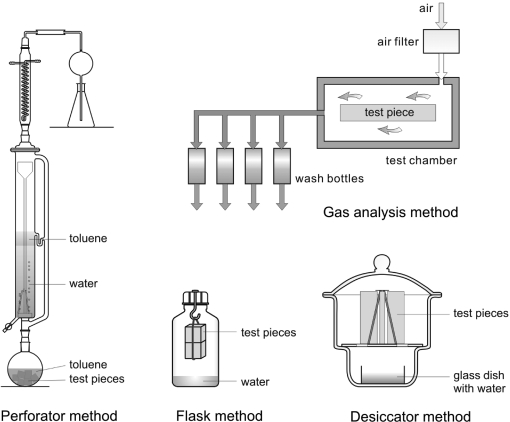
Standardized laboratory methods (perforator, gas analysis, flask, desiccator) for the determination of formaldehyde release from wood-based materials.
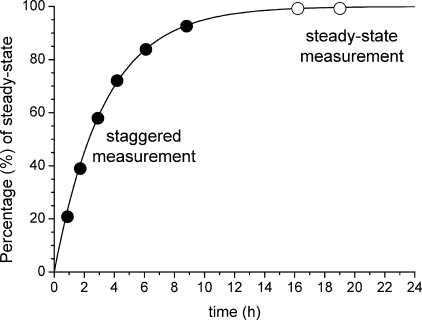
Modeled increase of the formaldehyde concentration after ventilation for a continuous source and an air exchange rate of n = 0.3 h−1 in the absence of sinks (see eq 18). The solid circles (●) represent a staggered measuring strategy; the open circles (○) represent a steady-state measuring strategy (note: the circles represent possible sampling times, not data from measurements).
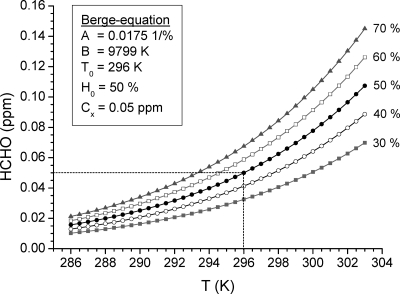
Variation of the formaldehyde concentration as a function of humidity and temperature, calculated with the Berge equation (eq 21). The initial conditions were T0 = 296 K, H0 = 50%, and Cx = 0.05 ppm.
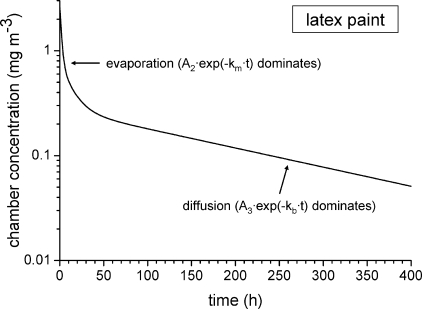
Emission of formaldehyde from latex paint, measured in a 0.053 m3 chamber with n = 0.5 h−1, T = 23 °C, r.h. = 50%, and loading L = 0.48 m2 m−3. The curve was obtained from a triple exponential fit of the experimental data (see eq 24). The parameters A1 = 1.926 mg m−3, n = 0.5 h−1, A2 = 0.513 mg m−3, km = 0.0745 h−1, A3 = 0.274 mg m−3, and kb = 0.0042 h−1 were taken from Chang et al.(75)
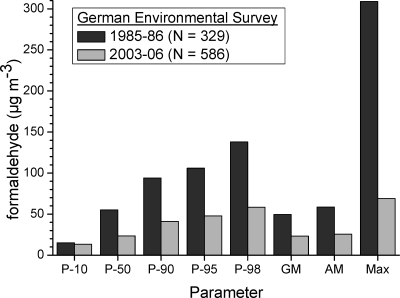
Comparison of two environmental surveys carried out by passive sampling in Germany in 1985/86 and 2003−2006. The data were taken from http://www.umweltbundesamt.de . According to the Federal Institute for Risk Assessment (BfR),(272) the results of the German Environmental Survey (GerES) can be regarded as representative for the German population.
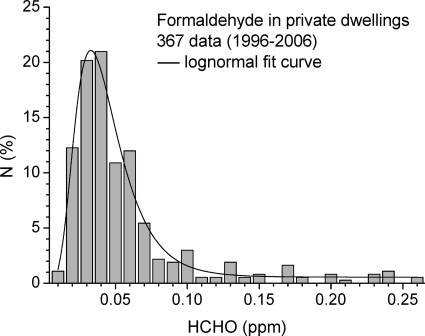
Distribution of formaldehyde concentrations in new prefabricated houses between 1996 and 2006. The log−normal fit curve was obtained from nonlinear regression analysis. The 50-P value was 0.04 ppm, and 14% of the data exceeded the German guideline value of 0.1 ppm.
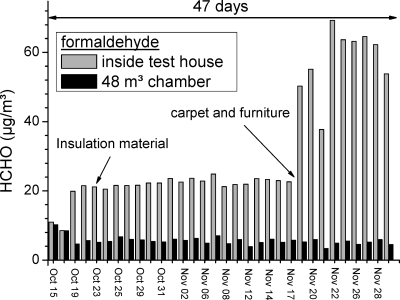
Influence of building products on the formaldehyde concentration inside a test house (n = 0.3 h−1) and in the 48 m3 stainless steel chamber (n = 2.0 h−1). Measurements were performed between Oct 15 and Nov 29, 2007 (from Salthammer and Mentese(154)).
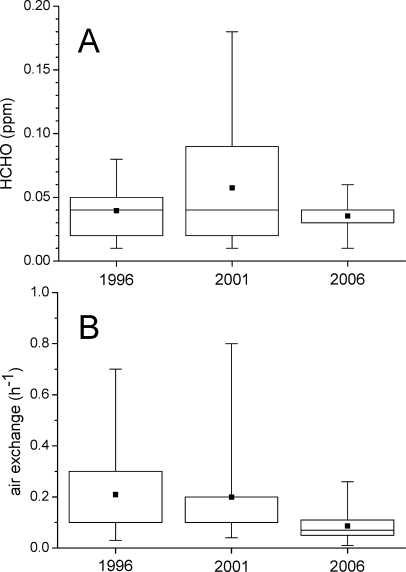
Box-and-whisker plots (min, max, mean, 25-P, 50-P, 75-P) of formaldehyde concentrations (A) and air exchange rates (B) for the years 1996, 2001, and 2006 (data from Figure 13).
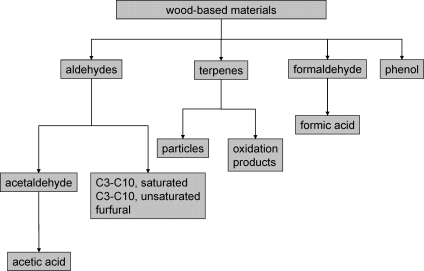
Possible VOC emissions related to formaldehyde for the case of a wood-based material.
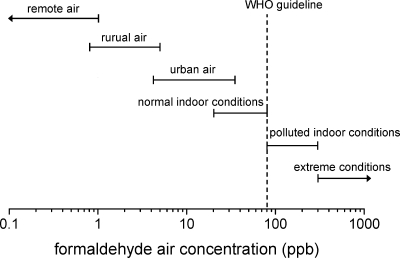
Range of formaldehyde concentrations in different environments.
References
-
- Walker J. F.Formaldehyde; Reinhold Publishing Corporation: New York, 1964.
-
- Roffael E.Formaldehyde Release from Particleboard and Other Wood Based Panel; Forest Research Institute Malaysia: Kuala Lumpur, 1993.
-
- Kerns W. D.; Pavkov K. L.; Donofrio D. J.; Gralla E. J.; Swenberg J. A. Cancer Res. 1983, 43, 4382. - PubMed
-
- Swenberg J. A.; Kerns W. D.; Mitchell R. I.; Gralla E. J.; Pavkov K. L. Cancer Res. 1980, 40, 3398. - PubMed
-
- SCHER.Opinion on risk assessment on indoor air quality; European Commission: Brussels, 2007.
LinkOut - more resources
Full Text Sources
Other Literature Sources
