

Augmentation of 3-methylcholanthrene-induced bioactivation in the human hepatoma cell line HepG2 by the calcium channel blocker nicardipine
- PMID: 20067464
- PMCID: PMC11158203
- DOI: 10.1111/j.1349-7006.2009.01454.x
Augmentation of 3-methylcholanthrene-induced bioactivation in the human hepatoma cell line HepG2 by the calcium channel blocker nicardipine
Abstract
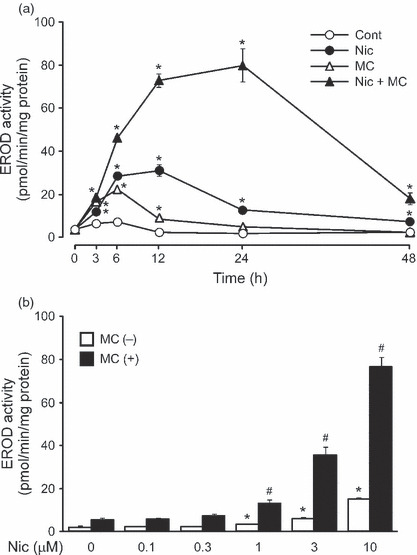
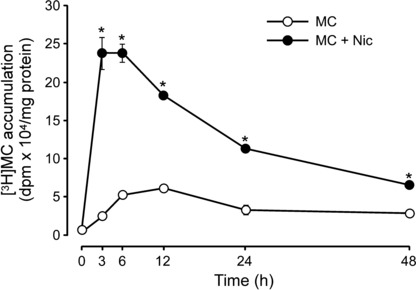
The abilities of the dihydropyridine calcium channel blocker nicardipine (Nic) to induce cytochrome P450 1 family enzymes (CYP1s) and to enhance the 3-methylcholanthrene (MC)-mediated induction of CYP1s and formation of MC-DNA adduct were examined in the human hepatoma cell line HepG2. The results from real time RT-PCR analysis demonstrated that Nic could induce CYP1 mRNAs and enhance the MC-mediated induction of the CYP1 mRNAs. The luciferase-reporter gene assay using the HepG2-A10 cell line, which has been previously established for the screening of aryl hydrocarbon receptor (AhR) activators, also indicated the augmentation of MC-mediated activation of AhR (induction of luciferase) by Nic, although Nic showed limited capacity for the activation of AhR. Furthermore, the results from the Western blot analysis of CYP1s, the enzyme activity assay, and the assay for MC-DNA adduct formation indicated that Nic could enhance the MC-mediated induction of CYP1s, especially CYP1A1. Furthermore, the intracellular accumulation level of [(3)H]MC after treatment of HepG2 cells with [(3)H]MC significantly increased in the presence of Nic. The present findings demonstrate that Nic can enhance the MC-mediated induction of CYP1s, especially CYP1A1, and the formation of MC-DNA adduct in HepG2 cells. Furthermore, the augmentation of the MC-mediated bioactivation by Nic is demonstrated to occur mainly through an increase in intracellular accumulation of MC.
Figures


Similar articles
-
Regulation of cytochrome P450 enzymes by aryl hydrocarbon receptor in human cells: CYP1A2 expression in the LS180 colon carcinoma cell line after treatment with 2,3,7,8-tetrachlorodibenzo-p-dioxin or 3-methylcholanthrene.Biochem Pharmacol. 1998 Sep 1;56(5):599-612. doi: 10.1016/s0006-2952(98)00208-1. Biochem Pharmacol. 1998. PMID: 9783729
-
Induction of CYP1A1, CYP1A2, and CYP1B1 mRNAs by nitropolycyclic aromatic hydrocarbons in various human tissue-derived cells: chemical-, cytochrome P450 isoform-, and cell-specific differences.Arch Toxicol. 2002 Jun;76(5-6):287-98. doi: 10.1007/s00204-002-0340-z. Epub 2002 Apr 10. Arch Toxicol. 2002. PMID: 12107646
-
Polycyclic aromatic hydrocarbon-inducible DNA adducts: evidence by 32P-postlabeling and use of knockout mice for Ah receptor-independent mechanisms of metabolic activation in vivo.Int J Cancer. 2003 Jan 1;103(1):5-11. doi: 10.1002/ijc.10784. Int J Cancer. 2003. PMID: 12455047
-
The aryl hydrocarbon receptor pathway and the response to 3-methylcholanthrene are altered in the liver of adrenalectomized rats.Drug Metab Dispos. 2011 Jan;39(1):83-91. doi: 10.1124/dmd.110.035584. Epub 2010 Sep 29. Drug Metab Dispos. 2011. PMID: 20881032
-
Biological roles of cytochrome P450 1A1, 1A2, and 1B1 enzymes.Arch Pharm Res. 2021 Jan;44(1):63-83. doi: 10.1007/s12272-021-01306-w. Epub 2021 Jan 23. Arch Pharm Res. 2021. PMID: 33484438 Review.
References
-
- Wood AW, Chang RL, Levin W et al. Metabolic activation of 3‐methylcholanthrene and its metabolites to products mutagenic to bacterial and mammalian cells. Cancer Res 1978; 38: 3398–404. - PubMed
-
- Conney AH. Induction of microsomal enzymes by foreign chemicals and carcinogenesis by polycyclic aromatic hydrocarbons: G. H. A. Clowes memorial lecture. Cancer Res 1982; 42: 4875–917. - PubMed
Publication types
MeSH terms
Substances
LinkOut - more resources
Full Text Sources
Medical
