. 2010 Feb 1;159(3):586-603.
doi: 10.1111/j.1476-5381.2009.00563.x. Epub 2010 Jan 8.

Gangliosides induce autophagic cell death in astrocytes

Affiliations

Gangliosides induce autophagic cell death in astrocytes

Jaegyu Hwang et al. Br J Pharmacol. .

Abstract

Background and purpose: Gangliosides, sialic acid-containing glycosphingolipids, abundant in brain, are involved in neuronal function and disease, but the precise molecular mechanisms underlying their physiological or pathological activities are poorly understood. In this study, the pathological role of gangliosides in the extracellular milieu with respect to glial cell death and lipid raft/membrane disruption was investigated.

Experimental approach: We determined the effect of gangliosides on astrocyte death or survival using primary astrocyte cultures and astrocytoma/glioma cell lines as a model. Signalling pathways of ganglioside-induced autophagic cell death of astrocytes were examined using pharmacological inhibitors and biochemical and genetic assays.

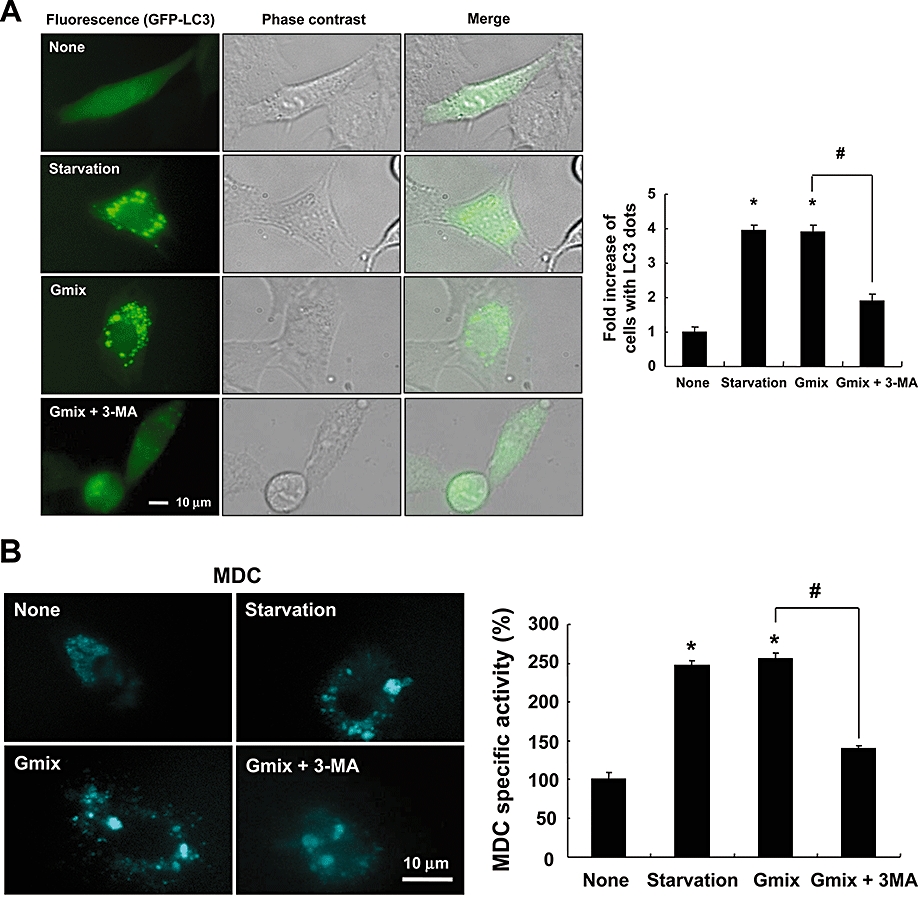
Key results: Gangliosides induced autophagic cell death in based on the following observations. Incubation of the cells with a mixture of gangliosides increased a punctate distribution of fluorescently labelled microtubule-associated protein 1 light chain 3 (GFP-LC3), the ratio of LC3-II/LC3-I and LC3 flux. Gangliosides also increased the formation of autophagic vacuoles as revealed by monodansylcadaverine staining. Ganglioside-induced cell death was inhibited by either a knockdown of beclin-1/Atg-6 or Atg-7 gene expression or by 3-methyladenine, an inhibitor of autophagy. Reactive oxygen species (ROS) were involved in ganglioside-induced autophagic cell death of astrocytes, because gangliosides induced ROS production and ROS scavengers decreased autophagic cell death. In addition, lipid rafts played an important role in ganglioside-induced astrocyte death.

Conclusions and implications: Gangliosides released under pathological conditions may induce autophagic cell death of astrocytes, identifying a neuropathological role for gangliosides.


Figures

Figure 1
Figure 1
Gangliosides induced cell death in astrocytes. Primary astrocytes (A) or C6 glioma cells (B) were treated with a ganglioside mixture (Gmix; 5–500 µg·mL−1) for 24–72 h, and then cell viability was assessed by 3-(4, 5-dimethylthiazol-2-yl)-2, 5-diphenyltetrazolium bromide (MTT) assay. Also, primary astrocytes (24 h) or C6 cells (72 h) were treated with the Gmix (50 µg·mL−1), and then viability assayed by Trypan blue dye exclusion (C) or lactate dehydrogenase (LDH) release (D). A representative microscopic image of Trypan blue stained cells is shown (C; upper). The LDH release was expressed as a percentage of total cellular LDH. The data were expressed as the mean ± SD (n= 3). The results represent more than three independent experiments (*P < 0.05, **P < 0.001, different from untreated cells at each time point).
Figure 2
Figure 2
Gangliosides induced autophagy in astrocytes. C6 glioma cells transfected with GFP-LC3 (microtubule-associated protein 1 light chain 3, LC3 tagged with green fluorescent protein) cDNA were either treated with the ganglioside mixture (Gmix; 50 µg·mL−1) in the absence or presence of 3-methyladenine (3-MA) (2 mM) for 24 h or placed under amino acid starvation conditions (Earle's balanced salt solution at 37°C for 2 h). The formation of vacuoles containing GFP-LC3 (dots) was examined by fluorescence or phase contrast microscopy, as shown in the representative microscopic images (original magnification, ×600) (left); a minimum of 200 cells were counted per sample to obtain fold increase of cells with LC3 dots (right) (A). In another set of experiments, C6 cells were similarly treated with the ganglioside mixture or placed under starvation conditions and incubated with 0.05 mM monodansylcadaverine (MDC) for 10 min. Cells were then analysed by fluorescence microscopy (original magnification, ×600), or the intracellular MDC was measured by fluorescence plate reader after cells were lysed (B). Conversion of LC3-I to LC3-II was determined by Western blotting after astrocytes or C6 cells were treated with the Gmix (50 µg·mL−1) or starvation conditions in the presence or absence of the lysosomal inhibitor NH4Cl (30 mM) for 24 h. α-Tubulin was used as a loading control. Quantification of LC3-II protein levels was performed by densitometric analysis, which was then normalized to α-tubulin level (lower). The densitometric data are mean ± SD from more than three experiments (C,D). The formation of GFP-LC3 vacuoles (dots) was examined under by fluorescence microscopy, as shown in the representative microscopic images (original magnification, ×400); a minimum of 200 cells were counted per sample (E). The data were expressed as the mean ± SD (n= 3). Results shown are representative of more than three independent experiments (*P < 0.001 compared with no treatment; #P < 0.001 between the treatments indicated).
Figure 2
Figure 2
Gangliosides induced autophagy in astrocytes. C6 glioma cells transfected with GFP-LC3 (microtubule-associated protein 1 light chain 3, LC3 tagged with green fluorescent protein) cDNA were either treated with the ganglioside mixture (Gmix; 50 µg·mL−1) in the absence or presence of 3-methyladenine (3-MA) (2 mM) for 24 h or placed under amino acid starvation conditions (Earle's balanced salt solution at 37°C for 2 h). The formation of vacuoles containing GFP-LC3 (dots) was examined by fluorescence or phase contrast microscopy, as shown in the representative microscopic images (original magnification, ×600) (left); a minimum of 200 cells were counted per sample to obtain fold increase of cells with LC3 dots (right) (A). In another set of experiments, C6 cells were similarly treated with the ganglioside mixture or placed under starvation conditions and incubated with 0.05 mM monodansylcadaverine (MDC) for 10 min. Cells were then analysed by fluorescence microscopy (original magnification, ×600), or the intracellular MDC was measured by fluorescence plate reader after cells were lysed (B). Conversion of LC3-I to LC3-II was determined by Western blotting after astrocytes or C6 cells were treated with the Gmix (50 µg·mL−1) or starvation conditions in the presence or absence of the lysosomal inhibitor NH4Cl (30 mM) for 24 h. α-Tubulin was used as a loading control. Quantification of LC3-II protein levels was performed by densitometric analysis, which was then normalized to α-tubulin level (lower). The densitometric data are mean ± SD from more than three experiments (C,D). The formation of GFP-LC3 vacuoles (dots) was examined under by fluorescence microscopy, as shown in the representative microscopic images (original magnification, ×400); a minimum of 200 cells were counted per sample (E). The data were expressed as the mean ± SD (n= 3). Results shown are representative of more than three independent experiments (*P < 0.001 compared with no treatment; #P < 0.001 between the treatments indicated).
Figure 3
Figure 3
Gangliosides induced autophagic cell death in astrocytes. Primary astrocytes were pretreated with 3-methyladenine (3-MA) (2 mM) for 30 min prior to treatment with the ganglioside mixture (Gmix; 50 µg·mL−1) for 24 h or starvation conditions. Cell viability was assessed by 3-(4, 5-dimethylthiazol-2-yl)-2, 5-diphenyltetrazolium bromide (MTT) assay (A) or lactate dehydrogenase (LDH) assay (B). U87MG human glioma cells were transfected with 40 nM of control green fluorescent protein siRNA, beclin-1/Atg-6 siRNA or Atg-7 siRNA. At 24 h post transfection, cells were treated with the Gmix (50 µg·mL−1) for 24 h. Then, cellular viability was determined by 2, 3-bis (2-methoxy-4-nitro-5-sulfophenyl)-2H-tetrazolium-5-carboxanilide inner salt (XTT) assay (C), or intracellular monodansylcadaverine (MDC) was measured by fluorescence, after cell lysis (D). Two different siRNA sequences (siRNA-1 and siRNA-2) for each Atg gene were used to rule out off-target effects. U87MG cells were treated with the Gmix (50 µg·mL−1), rottlerin (2.5 µM) and TRAIL (100 ng·mL−1) for 24 h as indicated. Knockdown of Atg-6/Atg-7 expression and poly (ADP-ribose) polymerase (PARP) cleavage was evaluated by Western blot analysis (E). Anti-HSC70 antibody served as control for the loading of protein levels. Quantification of Atg-6 and Atg-7 protein levels was performed by densitometric analysis (lower). All data were expressed as the mean ± SD (n= 3). Results shown are representative of more than three independent experiments (*P < 0.05, **P < 0.001 compared with no treatment; #P < 0.05 between the treatments indicated).
Figure 4
Figure 4
Role of reactive oxygen species (ROS) in the autophagic cell death of astrocytes induced by gangliosides. Primary astrocytes or C6 glioma cells were pretreated with ROS scavengers such as α-tocopherol (α-toco; 10 µM), N-acetyl cysteine (NAC) (1 mM) and trolox (500 µM) for 30 min before treatment with the ganglioside mixture (Gmix; 50 µg·mL−1). The cell viability was assessed by 3-(4, 5-dimethylthiazol-2-yl)-2, 5-diphenyltetrazolium bromide (MTT) assay (A,B). Formation of GFP-LC3 (microtubule-associated protein 1 light chain 3, LC3 tagged with green fluorescent protein) vacuoles (dots) was examined, after C6 cells transfected with GFP-LC3 cDNA were treated with H2O2 (500 µM) for 24 h. Representative microscopic images are shown (original magnification, ×600) (C). Primary astrocytes were treated with H2O2 (500 µM) for 24 h, and then incubated with 0.05 mM monodansylcadaverine (MDC) for 10 min. Cells were then analysed by fluorescence microscopy (original magnification, ×600) (D). The formation of GFP-LC3 vacuoles (dots) was examined by fluorescence microscopy, as shown in the representative microscopic images (original magnification, ×400); at least 200 cells were counted per sample (E,H). After primary astrocytes were treated with H2O2 (500 µM) or Gmix (50 µg·mL−1) in the presence or absence of antioxidants or diphenyleneiodonium (DPI) (1 nM or 1 µM), intracellular MDC was similarly measured by fluorescence, after cell lysis (F,I). Astrocytes or C6 cells were treated with the Gmix (50 or 500 µg·mL−1) for 12 h. ROS was measured by H2DCFDA fluorescence by flow cytometric analysis (G). The data were expressed as the mean ± SD (n= 3). Results shown are representative of more than three independent experiments (*P < 0.01, **P < 0.001 compared with Gmix treatment alone; #P < 0.001 compared with no treatment).
Figure 4
Figure 4
Role of reactive oxygen species (ROS) in the autophagic cell death of astrocytes induced by gangliosides. Primary astrocytes or C6 glioma cells were pretreated with ROS scavengers such as α-tocopherol (α-toco; 10 µM), N-acetyl cysteine (NAC) (1 mM) and trolox (500 µM) for 30 min before treatment with the ganglioside mixture (Gmix; 50 µg·mL−1). The cell viability was assessed by 3-(4, 5-dimethylthiazol-2-yl)-2, 5-diphenyltetrazolium bromide (MTT) assay (A,B). Formation of GFP-LC3 (microtubule-associated protein 1 light chain 3, LC3 tagged with green fluorescent protein) vacuoles (dots) was examined, after C6 cells transfected with GFP-LC3 cDNA were treated with H2O2 (500 µM) for 24 h. Representative microscopic images are shown (original magnification, ×600) (C). Primary astrocytes were treated with H2O2 (500 µM) for 24 h, and then incubated with 0.05 mM monodansylcadaverine (MDC) for 10 min. Cells were then analysed by fluorescence microscopy (original magnification, ×600) (D). The formation of GFP-LC3 vacuoles (dots) was examined by fluorescence microscopy, as shown in the representative microscopic images (original magnification, ×400); at least 200 cells were counted per sample (E,H). After primary astrocytes were treated with H2O2 (500 µM) or Gmix (50 µg·mL−1) in the presence or absence of antioxidants or diphenyleneiodonium (DPI) (1 nM or 1 µM), intracellular MDC was similarly measured by fluorescence, after cell lysis (F,I). Astrocytes or C6 cells were treated with the Gmix (50 or 500 µg·mL−1) for 12 h. ROS was measured by H2DCFDA fluorescence by flow cytometric analysis (G). The data were expressed as the mean ± SD (n= 3). Results shown are representative of more than three independent experiments (*P < 0.01, **P < 0.001 compared with Gmix treatment alone; #P < 0.001 compared with no treatment).
Figure 5
Figure 5
Gangliosides inhibited the Akt/mTOR (mammalian target of rapamycin) pathway and activated the ERK pathway in astrocytes and C6 glioma cells. Astrocytes and C6 cells were pretreated with the mTOR inhibitor (rapamycin; 1–1000 nM), or the Akt inhibitor (1–4 µM) for 30 min before treatment with gangliosides mixture (Gmix; 50 µg·mL−1) for 24 h (primary astrocytes) or 72 h (C6 glioma cells). Afterwards, either cell viability was assessed by 3-(4, 5-dimethylthiazol-2-yl)-2, 5-diphenyltetrazolium bromide (MTT) assay (A,B) or intracellular monodansylcadaverine (MDC) was measured by fluorescence plate reader after cell lysis (C). The data were expressed as the mean ± SD (n= 3). Results represent more than three independent experiments (*P < 0.05, **P < 0.001 compared with Gmix treatment alone; #P < 0.001 compared with no treatment).
Figure 8
Figure 8
The ganglioside GT1b induced autophagic cell death of astrocytes. Primary astrocytes were treated with indicated concentrations of GM1, GD1a, GT1b or the ganglioside mixture (Gmix; 50 µg·mL−1) for 72 h. Cell viability was measured by 3-(4, 5-dimethylthiazol-2-yl)-2, 5-diphenyltetrazolium bromide (MTT) (A) or by Trypan blue dye exclusion assays (B) respectively. A representative phase contrast image is shown (B, left). The formation of GFP-LC3 (microtubule-associated protein 1 light chain 3, LC3 tagged with green fluorescent protein) vacuoles (dots) was examined by fluorescence microscopy, as shown in the representative microscopic images (original magnification, ×400); at least 200 cells were counted per sample (C). The data were expressed as the mean ± SD (n= 3). Results shown are representative of more than three independent experiments (*P < 0.001 compared with no treatment).
Figure 7
Figure 7
Role of reactive oxygen species and lipid rafts in ganglioside-induced conversion of microtubule-associated protein 1 light chain 3 (LC3)-I to LC3-II. C6 cells were treated with the ganglioside mixture (Gmix; 50 µg·mL−1) in the presence of either diphenyleneiodonium (DPI) (1 µM) or methyl β-cyclodextrin (MβCD) (250 µM) for 24 h. LC3 or α-tubulin was detected by Western blot analysis. Quantification of LC3-II protein levels was performed by densitometric analysis, which was then normalized to α-tubulin level (lower). The densitometric data are mean ± SD (n= 3); *P < 0.05 compared with Gmix treatment alone.
Figure 6
Figure 6
Lipid rafts were involved in ganglioside-induced autophagic cell death of astrocytes. Astrocytes were pretreated with methyl β-cyclodextrin (MβCD) (100–500 µM) for 30 min prior to treatment with the ganglioside mixture (Gmix; 50 µg·mL−1) for 24–48 h. The cell viability was assessed by 3-(4, 5-dimethylthiazol-2-yl)-2, 5-diphenyltetrazolium bromide (MTT) assay (A). Intracellular monodansylcadaverine (MDC) was measured by fluorescence plate reader after cell lysis (B). The data were expressed as the mean ± SD (n= 3). Results shown are representative of more than three independent experiments (*P < 0.001 compared with Gmix treatment alone; #P < 0.001 compared with no treatment).
Figure 9
Figure 9
Possible mechanisms for ganglioside-induced autophagic cell death in astrocytes. Gangliosides, via lipid rafts, initiate autophagic cell death signalling cascades in astrocytes. The ERK pathway and class III PI3K/beclin-1 complex may promote autophagic cell death in astrocytes. In contrast, Akt/mTOR pathway inhibits autophagic cell death. ROS appear to be important mediators of ganglioside-induced astrocyte cell death. The data obtained with various pharmacological inhibitors and siRNAs support the signalling pathways shown here. 3-MA, 3-methyladenine; DPI, diphenyleneiodonium; LC3, microtubule-associated protein 1 light chain 3; MβCD, methyl β-cyclodextrin; mTOR, mammalian target of rapamycin; PI3K, phosphatidylinositol 3-kinase; ROS, reactive oxygen species.

Similar articles

Cited by

References

    1. Alexander DE, Ward SL, Mizushima N, Levine B, Leib DA. Analysis of the role of autophagy in replication of herpes simplex virus in cell culture. J Virol. 2007;81:12128–12134. - PMC - PubMed
    1. Arico S, Petiot A, Bauvy C, Dubbelhuis PF, Meijer AJ, Codogno P, et al. The tumor suppressor PTEN positively regulates macroautophagy by inhibiting the phosphatidylinositol 3-kinase/protein kinase B pathway. J Biol Chem. 2001;276:35243–35246. - PubMed
    1. Avrova NF, Victorov IV, Tyurin VA, Zakharova IO, Sokolova TV, Andreeva NA, et al. Inhibition of glutamate-induced intensification of free radical reactions by gangliosides: possible role in their protective effect in rat cerebellar granule cells and brain synaptosomes. Neurochem Res. 1998;23:945–952. - PubMed
    1. Baehrecke EH. Autophagy: dual roles in life and death? Nat Rev Mol Cell Biol. 2005;6:505–510. - PubMed
    1. Barres BA, Barde Y. Neuronal and glial cell biology. Curr Opin Neurobiol. 2000;10:642–648. - PubMed

Publication types

MeSH terms