. 2010 Apr;23(2):225-37.
doi: 10.1111/j.1755-148X.2010.00667.x. Epub 2010 Jan 22.

PAX3 and SOX10 activate MET receptor expression in melanoma

Affiliations

PAX3 and SOX10 activate MET receptor expression in melanoma

Joseph B Mascarenhas et al. Pigment Cell Melanoma Res. 2010 Apr.

Abstract

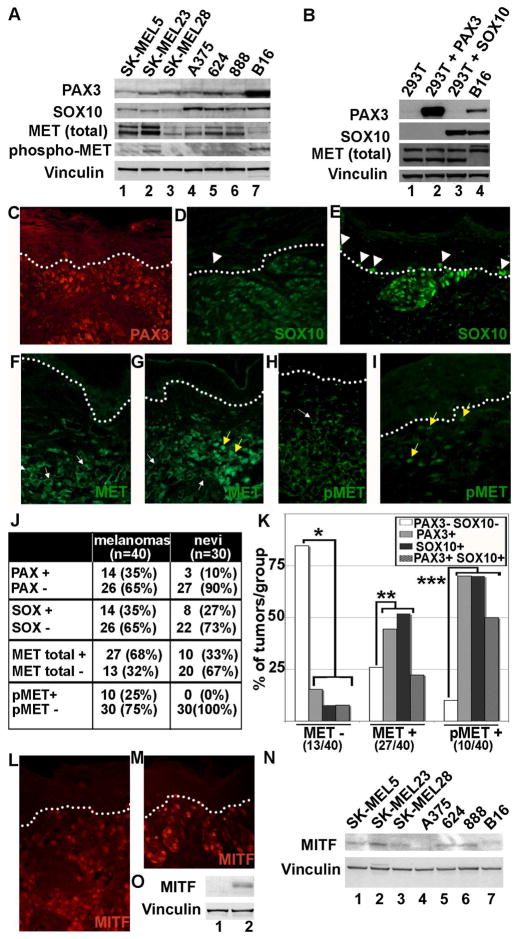
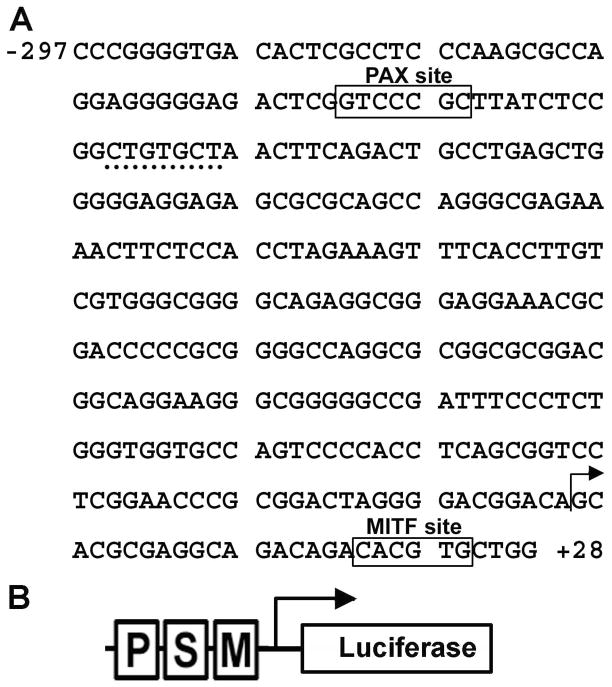
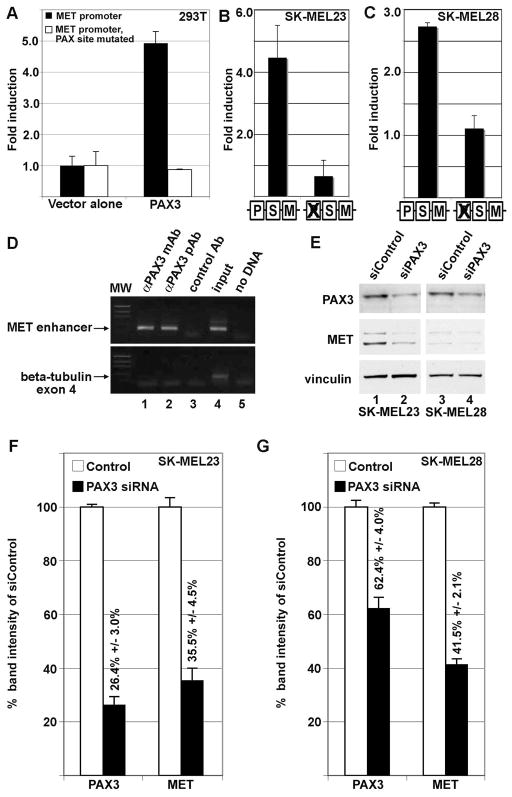
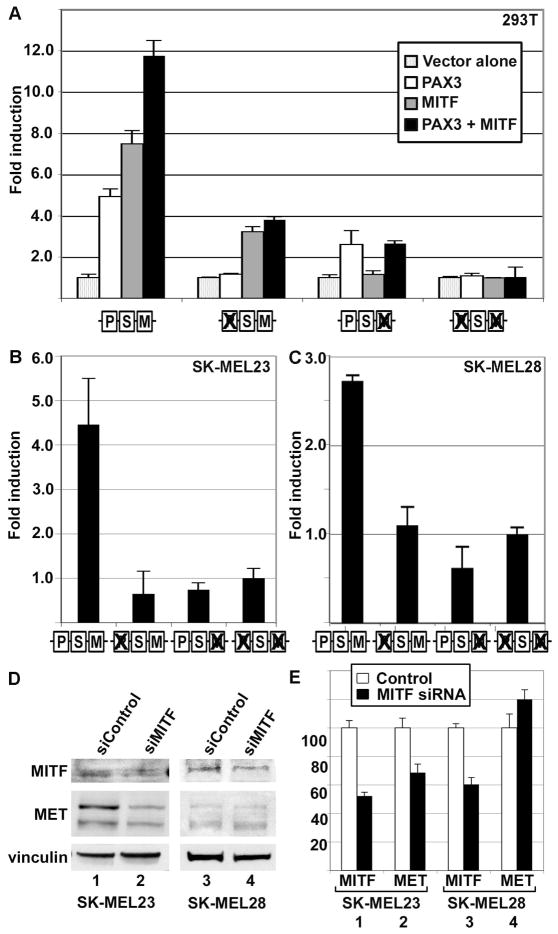
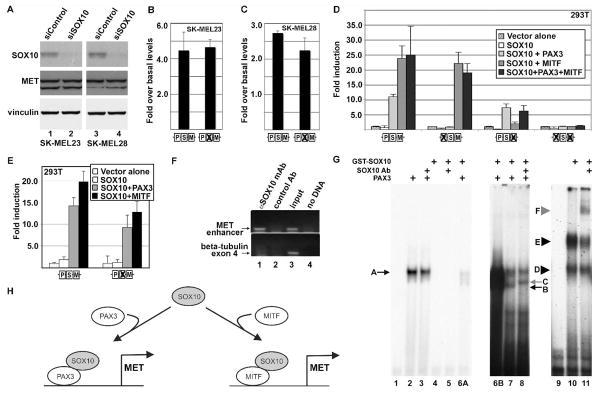
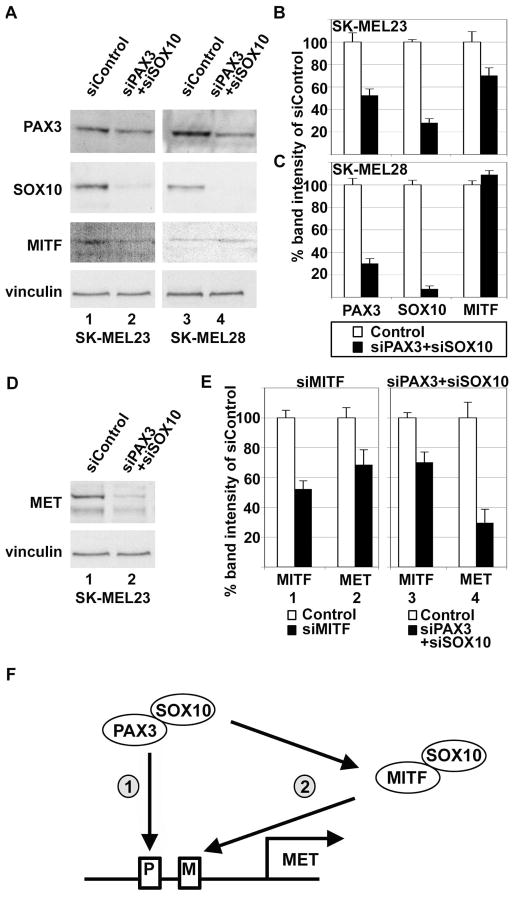
Melanoma is a cancer with a poorly understood molecular pathobiology. We find the transcription factors PAX3, SOX10, MITF, and the tyrosine kinase receptor MET expressed in melanoma cell lines and primary tumors. Analysis for MET expression in primary tumor specimens showed 27/40 (68%) of the samples displayed an increased expression of MET, and this expression was highly correlated with parallel expression of PAX3, SOX10, and MITF. PAX3 and MITF bind to elements in the MET promoter independently, without evidence of either synergistic activation or inhibition. SOX10 does not directly activate the MET gene alone, but can synergistically activate MET expression with either PAX3 or MITF. In melanoma cells, there was evidence of two pathways for PAX3 mediated MET induction: (i) direct activation of the gene, and (ii) indirect regulation through MITF. SK-MEL23 melanoma cells have both of these pathways intact, while SK-MEL28 melanoma cells only have the first pathway. In summary, we find that PAX3, SOX10 and MITF play an active role in melanoma cells by regulating the MET gene. In consequence, MET promotes the melanoma cancer phenotype by promoting migration, invasion, resistance to apoptosis, and tumor cell growth.


Figures

Figure 1
Figure 1
PAX3, SOX10, MITF and MET are expressed in melanoma cell lines and in primary tumors. (A) Western blot analysis of melanoma cell lines. Human melanoma cell lines (lanes 1–6) and the mouse melanoma cell line B16 (lane 7) all have expression of PAX3, SOX10, and MET to variable degrees. Vinculin levels are shown as a loading control in both (A) and (B). (B) Control western analysis for antibody specificity. HEK-293T cells lack expression of both PAX3 and SOX10 (lane 1) and were transfected with constructs expressing either PAX3 (lane 2) or SOX10 (lane 3). (C–I) Immunofluorescence for PAX3, SOX10, and MET in primary tumor samples. These examples are representative samples for melanoma tissues with expression for PAX3 (C), SOX10 (D, E), MET (F,G) or phosphorylated MET (pMET) (H,I). The dotted line demarcates the dermo-epidermal junction layer, which separates the upper keratinocyte layer in the epidermis and the lower connective tissue of the dermis. Normal melanocytes are located on this layer, and when found next to melanocytic lesions (white arrow heads), have either low/absent SOX10 expression (D) or high levels (E). MET expression was expressed in the cell membrane/cytosol (white arrows) or in the nucleus (yellow arrows). (J) Summary of the number of melanocytic lesions that expressed PAX3, SOX10, MET, or pMET. Tissue specimens are superficial spreading melanomas (n=40) or dysplastic but non-cancerous pigmented lesions (nevi) (n=30). (K) A graphical summary of the correlation of PAX3 and/or SOX10 expression with the presence or absence of MET and pMET. The compared groups (*, **, and ***) showed a significant difference from the expected mean (p<0.05). (L, M) Immunofluorescent staining for MITF expression in primary tumor samples. Two representative samples are shown. (N) Western blot analysis for MITF expression in melanoma cell lines. Human melanoma cell lines (lanes 1–6) and murine cell line B16 (lane 7) express variable levels of MITF. (O) Control western analysis for antibody specificity. HEK-293T cells lack expression of MITF (lane 1) and were transfected with an expression contruct for MITF (lane 2).
Figure 2
Figure 2
Sequence of the proximal human MET promoter and reporter construct. (A) The MET promoter segment contains the 297 base pairs directly 5′ directly upstream and 28 bases directly 3′ of the MET gene transcriptional start site. The previously described PAX and MITF sites are highlighted with boxes. A putative SOX site is underlined with a dotted line. The transcriptional start site is marked with an arrow. (B) Schematic of the MET promoter reporter construct. The sequence shown in (A) corresponds with the DNA segment contained in the MET promoter luciferase reporter construct utilized in Figures 3, 4, and 5. The PAX (P), SOX (S), and MITF (M) sites, transcriptional start site (arrow) and luciferase reporter gene cassette are shown in diagram form.
Figure 3
Figure 3
PAX3 activates the MET promoter. (A) PAX3 activates the MET promoter in HEK-293T cells. PAX3 induced luciferase expression 4.9±0.4 fold over vector alone with MET promoter reporter constructs with wild-type sequence (black bars) but not when the PAX site is mutated (white bars). (B,C) PAX3 regulates MET expression in SK-MEL23 (B) and SK-MEL28 (C) melanoma cells. Luciferase reporter is expressed from a construct containing MET promoter when the PAX site is intact or with the PAX site mutated (as illustrated by schematic, as described in Figure 2B). For calculation of fold light units over basal promoter activity (y axis), luciferase activity is measured in arbitrary light units, normalized against beta-galactosidase activity, and divided by the measurements obtained for reporter vector alone. Each bar represents n=9, with standard error of the mean as shown. (D) PAX3 protein is located on the endogenous MET promoter in SK-MEL23 cells. Chromatin Immunoprecipitation (ChIP) analysis utilized primers specific for the MET promoter region (top gels) or for exon 4 of the beta tubulin gene (bottom gels, negative control). Antibodies used for immunoprecipitations are either against PAX3 (monoclonal antibody lanes 1, and polyclonal antibody 2), or normal mouse IgG (control Ab, negative control lane 3). Input DNA was collected for each sample after cell sonication but before immunoprecipitation (lane 4). The “no DNA” lanes lacked a template during PCR amplification (water only, negative control lane 5). (E,F,G) Inhibition of PAX3 protein expression reduces MET receptor levels. Graphs shown in (F) and (G) are quantified densitometry readings of the western analysis shown in (E) of SK-MEL23 cells (lanes 1 and 2) or SK-MEL28 cells (lanes 3 and 4). Cells were transfected with either scrambled siRNA (E, lanes 1,3, F,G white bars) or gene specific siRNA (E, lanes 2,4, F,G black bars). For densitometry readings, bars represent percent of band intensity of the experimental sample compared to the controls, and these percentages are also indicated above each bar. This experiment is a representative of three independent western analyses.
Figure 4
Figure 4
MITF activates MET, and PAX3 does not inhibit this activation. (A) MITF and PAX3 independently activate the MET promoter in HEK-293T cells. PAX3 induced luciferase expression 4.9±0.4 fold (white bar, first set), and MITF activated luciferase 7.5±0.6 fold over vector alone (grey bar, first set), and both proteins stimulated reporter expression 11.8±0.7 fold (black bar, second set). Ability of PAX3 and/or MITF to drive expression of reporter was eliminated by mutating the specific binding element (as illustrated by schematic, as described in Figure 2B) and reduced but did not eliminate the ability of the other factor to activate through un-mutated sites. (B,C) PAX3 and MITF regulate MET expression in SK-MEL23 (B) and SK-MEL28 (C) melanoma cells. Luciferase reporter is expressed from a construct containing MET promoter when the PAX and/or MITF site is intact or mutated (as illustrated by schematic, as described in Figure 2B). For calculation of fold light units over basal promoter activity (y axis), luciferase activity is measured in arbitrary light units, normalized against beta-galactosidase activity, and divided by the measurements obtained for reporter vector alone. Each bar represents n=9, with standard error of the mean as shown. (D,E) Inhibition of MITF protein expression reduces MET protein levels in SK-MEL23 but not in SK-MEL28 melanoma cells. Graph shown in (E) is the quantified densitometry readings of the western analysis shown in (D). Numbers of the bar sets shown in (E) correspond to the lane numbers shown in (D). Cells were transfected with either scrambled siRNA (D, lanes 1,3, E white bars) or gene specific siRNA (D, lanes 2,4, E black bars). For densitometry readings, graphs represent percent of band intensity of the experimental sample compared to the control. In SKMEL23 cells, inhibition of MITF expression (52.3%±2.5% of controls, bar set 1 in E) leads to an inhibition of MET expression of 68.6%±5.9% (bar set 2). In SK-MEL28 cells, inhibition of MITF expression (60.4%±4.8%, bar set 3) did not lead to a significant change in MET protein levels (119.%8±6.9%, bar set 4). This experiment is a representative of two independent western analyses.
Figure 5
Figure 5
SOX10 does not appear to directly activate the MET gene, but synergistically activates expression with either PAX3 or MITF. (A) Inhibition of SOX10 protein expression does not affect MET protein levels. Western analysis of cells transfected with either scrambled siRNA (lanes 1,3) or gene specific siRNA (lanes 2,4) show >90% reduction of SOX10 protein but no significant change in MET levels. (B,C) Alteration of a putative SOX site in the MET promoter does not alter reporter expression in SK-MEL23 (B) and SK-MEL28 (C) melanoma cells. (D) SOX10 does not activate the MET promoter in HEK-293T cells alone (white bars), but synergistically activates expression with either PAX3 (light grey) or MITF (dark grey). There is no significant increase in reporter expression when SOX10 is present with both PAX3 and MITF (black bars) than with MITF alone. Activation of the wild-type reporter construct (first bar set) with SOX10 alone is 0.9±0.7 fold over vector alone (white bar), 11.0±0.8 fold with PAX3 (light grey bar), 23.8±4.2 fold with MITF (grey bar), and 25.0±9.6 fold with both PAX3 and MITF (black bar). (E) Synergistic activation of the MET promoter reporter construct by SOX10 and PAX3 or MITF is unaffected when the putative SOX10 site is mutated. Reporter expression is not significantly reduced from wild-type reporter levels (bar set 1) when the putative SOX10 site shown in Figure 2 is mutated (bar set 2). For calculation of fold light units over basal promoter activity (y axis), luciferase activity is measured in arbitrary light units, normalized against beta-galactosidase activity, and divided by the measurements obtained for reporter vector alone. Each bar represents n=9, with standard error of the mean as shown. (F) SOX10 protein is located on the endogenous MET promoter in SK-MEL23 cells. Chromatin Immunoprecipitation (ChIP) analysis utilized primers specific for the MET promoter region (top gels) or for exon 4 of the beta tubulin gene (bottom gels, negative control). Antibodies used for the immunoprecipitation are either against SOX10 (lane 1), or normal mouse IgG (control Ab, negative control lane 2). Input DNA was collected for each sample after cell sonication but before immunoprecipitation (positive control lane 3). The no DNA lanes lacked a template during PCR amplification (water only, negative control lane 4). (G) SOX10 does not directly bind to the enhancer, but is in complex with PAX3. Two probes were utilized for EMSA analysis, one containing the MET enhancer (lanes 1–8) or the P0 probe (SOX10 positive control, lanes 9–11). Lanes 1-6A are a short film exposure and lanes 6B-8 are a long exposure of the same gel. Lanes 6A and 6B are the same lane with different exposure times. Lane 1 is probe alone without the addition of PAX3 or SOX10 proteins. PAX3 binds to the MET enhancer and produces a slow migrating band (lane 2, arrow A) and this migration is not altered by the addition of SOX10 antibody (lane 3). SOX10 does not bind to the probe on its own (lane 4) or with SOX10 antibody (lane 5). PAX3 and SOX10 together results in a band migrating at the same level as PAX3 alone (arrow A) and an additional band (arrow B) with high levels (lane 6A,6B) or low levels (lane 7) of SOX10 protein. Addition of a SOX10-specific antibody alters the migration of this second band (lane 8, grey arrow C). A probe comprising sequence from the P0 promoter is utilized as a positve control for SOX10 binding (lanes 9–11). Lanes include probe without SOX10 protein (lane 9), or with SOX10 protein, resulting in two slow migrating bands (lane 10, arrowheads D and E). The addition of SOX10-specific antibody produces a slower migrating band (lane 11, grey arrowhead F). (H) Model for SOX10 synergistic activation of the MET promoter. SOX10 directly interacts with PAX3 or MITF, and this complex is recruited to an enhancer in the 5′ proximal MET promoter to drive gene expression.
Figure 6
Figure 6
PAX3 and SOX10 activate MET expression either directly, or directly and indirectly, in melanoma cells. (A,B,C) Inhibition of both PAX3 and SOX10 protein expression reduces MITF protein levels in SK-MEL23 but not in SK-MEL28 melanoma cells. Western analysis of cells transfected with either scrambled siRNA (lanes 1,3) or gene specific siRNA (lanes 2,4). Graph shown in (B) is the quantified densitometry readings of the western analysis of (A), lanes 1 and 2, and graph shown in (C) is densitometry of lanes 3 and 4. In SK-MEL23 cells (B), inhibition of both PAX3 and SOX10 leads to a reduction of PAX3, SOX10, and MITF 52.5%±5.7%, 28.2%±3.7%, and 70.2%±6.8%, respectively. In SK-MEL28 cells (C), inhibition of both PAX3 and SOX10 leads to a reduction of PAX3 (30.0%±4.3%) and SOX10 (7.5%±2.6%), but no significant reduction of MITF (109.1%±3.7%). (D) Western analysis for MET expression in SK-MEL23 cells transfected with either scrambled siRNA (lanes 1,3) or gene specific siRNA (lanes 2,4). These samples are the same as those shown in lanes 1 and 2 of panel A. (E) Comparison of the inhibition of MET protein expression between targeting MITF (bar sets 1,2) and targeting both PAX3 and SOX10 (bar sets 3,4) in SK-MEL23 cells. Bar sets 1 and 2 show densitometry reading of western analyses shown in Figure 4D,E (lanes 1,2) where inhibition of MITF expression (52.3%±2.5% of controls, bar set 1) leads to an inhibition of MET expression of 68.6%±5.9% (bar set 2). Bar sets 3 and 4 show densitometry of the western analysis shown in (D), where inhibition of both PAX3 and SOX10 expression lead to a reduction of MITF (70.2%±6.8% of controls, bar set 3) and MET (29.6%±9.1%, bar set 4) protein expression. (F) A model for direct and indirect upstream regulation of MET by PAX3 and SOX10. PAX3 and SOX10 can bind directly to upstream enhancer elements in the MET gene locus (arrow 1), or can work through an indirect pathway (arrow 2), where PAX3 and SOX10 regulates the expression of MITF, and MITF with or without SOX10 can activate MET expression.

References

    1. Beuret L, Flori E, Denoyelle C, Bille K, Busca R, Picardo M, Bertolotto C, Ballotti R. J Biol Chem. 2007;282:14140–7. - PubMed
    1. Bondurand N, Pingault V, Goerich DE, Lemort N, Sock E, Caignec CL, Wegner M, Goossens M. Hum Mol Genet. 2000;9:1907–17. - PubMed
    1. Cook AL, Smith AG, Smit DJ, Leonard JH, Sturm RA. Exp Cell Res. 2005;308:222–35. - PubMed
    1. Cruz J, Reis-Filho JS, Silva P, Lopes JM. Oncology. 2003;65:72–82. - PubMed
    1. Epstein JA, Shapiro DN, Cheng J, Lam PY, Maas RL. Proc Natl Acad Sci U S A. 1996;93:4213–8. - PMC - PubMed

Publication types

MeSH terms