. 2010 May 1;79(9):1317-26.
doi: 10.1016/j.bcp.2009.12.026. Epub 2010 Jan 11.

Activation of distinct P2Y receptor subtypes stimulates insulin secretion in MIN6 mouse pancreatic beta cells

Affiliations

Activation of distinct P2Y receptor subtypes stimulates insulin secretion in MIN6 mouse pancreatic beta cells

Ramachandran Balasubramanian et al. Biochem Pharmacol. .

Abstract

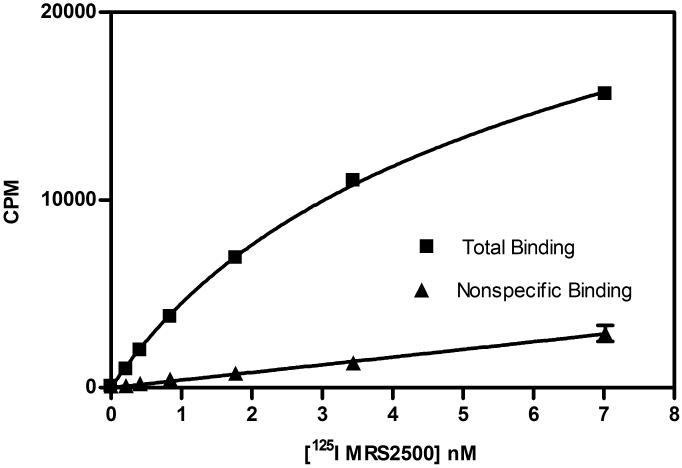
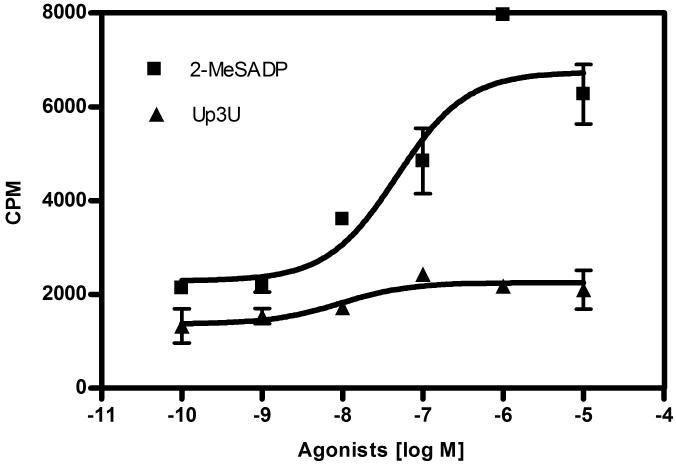
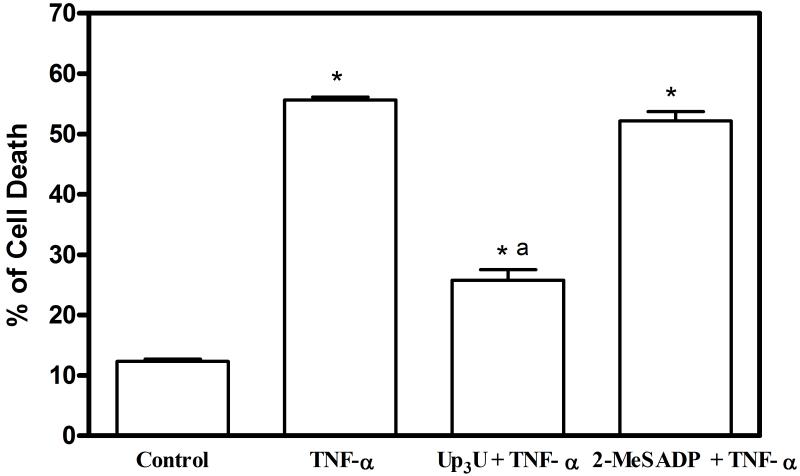
Extracellular nucleotides and their receptor antagonists have therapeutic potential in disorders such as inflammation, brain disorders, and cardiovascular diseases. Pancreatic beta cells express several purinergic receptors, and reported nucleotide effects on insulin secretion are contradictory. We studied the effect of P2Y receptors on insulin secretion and cell death in MIN6, mouse pancreatic beta cells. Expression of P2Y(1) and P2Y(6) receptors was revealed by total mRNA analysis using RT-PCR. MIN6 cells were stimulated in the presence of 16.7 mM glucose with or without P2Y(1) and P2Y(6) agonists, 2-MeSADP and Up(3)U, respectively. Both the agonists increased insulin secretion with EC(50) values of 44.6+/-7.0 nM and 30.7+/-12.7 nM respectively. The insulin secretion by P2Y(1) and P2Y(6) agonists was blocked by their selective antagonists MRS2179 and MRS2578, respectively. Binding of the selective P2Y(1) receptor antagonist radioligand [125I]MRS2500 in MIN6 cell membranes was saturable (K(D) 4.74+/-0.47 nM), and known P2Y(1) ligands competed with high affinities. Inflammation and glucose toxicity lead to pancreatic beta cell death in diabetes. Flow cytometric analysis revealed that Up(3)U but not 2-MeSADP protected MIN6 cells against TNF-alpha induced apoptosis. Overall, the results demonstrate that selective stimulation of P2Y(1) and P2Y(6) receptors increases insulin secretion that accompanies intracellular calcium release, suggesting potential application of P2Y receptor ligands in the treatment of diabetes.


Figures

Figure 1
Figure 1
Structures of nucleotide agonists (A) and antagonists (B) used as pharmacological probes of P2Y1 and P2Y6 receptors.
Figure 2
Figure 2
RT-PCR analysis of the mRNAs of three P2Y receptor subtypes in MIN6 cells.
Figure 3
Figure 3
(A) Saturation curve and (B) Scatchard analysis for [125I]MRS2500 binding in MIN6 cell membranes. The figures are from a representative experiment, and the KD value was 4.74±0.47 nM. Data represent mean±s.e.m, n=3.
Figure 3
Figure 3
(A) Saturation curve and (B) Scatchard analysis for [125I]MRS2500 binding in MIN6 cell membranes. The figures are from a representative experiment, and the KD value was 4.74±0.47 nM. Data represent mean±s.e.m, n=3.
Figure 4
Figure 4
(A) The effect of P2Y1 and P2Y6 agonists, 2-MeSADP and Up3U respectively, on insulin secretion was studied in the presence of 16.7 mM glucose. EC50 (nM) values obtained were: 2-MeSADP (EC50 = 44.6±7.0), MRS2365 (EC50 = 25.8±5.6), and Up3U (EC50 = 30.7±12.7). (B) Effect of muscarinic receptor agonist (oxotremorine-M) and P2Y1 receptor agonists (ADP and 2-MeSADP) on insulin secretion in the presence of 16.7 mM glucose. (C) Effect of P2Y1 antagonist, MRS2179 (30 μM), and P2Y13 antagonist, MRS2211 (30 μM), on insulin secretion induced by 2-MeSADP and the effect of P2Y6 antagonist MRS2578 (10 μM) on Up3U induced insulin secretion. (D) Glucose-dependent increase in insulin secretion observed in response to 2-MeSADP (10 μM) and Up3U (10 μM) was evaluated under increasing concentrations of glucose in MIN6 cells. Insulin secretion by both 2-MeSADP and Up3U was significantly increased in the presence of higher glucose concentrations compared with 5 mM glucose concentration. Data represent mean±s.e.m, n=3. Analysis of results was performed by ANOVA, followed by Tukey-Kramer multiple comparison test. *P<0.05 when compared to control; aP<0.05 when compared to 10 μM 2-MeSADP; bP<0.05 when compared to 10 μM Up3U.
Figure 4
Figure 4
(A) The effect of P2Y1 and P2Y6 agonists, 2-MeSADP and Up3U respectively, on insulin secretion was studied in the presence of 16.7 mM glucose. EC50 (nM) values obtained were: 2-MeSADP (EC50 = 44.6±7.0), MRS2365 (EC50 = 25.8±5.6), and Up3U (EC50 = 30.7±12.7). (B) Effect of muscarinic receptor agonist (oxotremorine-M) and P2Y1 receptor agonists (ADP and 2-MeSADP) on insulin secretion in the presence of 16.7 mM glucose. (C) Effect of P2Y1 antagonist, MRS2179 (30 μM), and P2Y13 antagonist, MRS2211 (30 μM), on insulin secretion induced by 2-MeSADP and the effect of P2Y6 antagonist MRS2578 (10 μM) on Up3U induced insulin secretion. (D) Glucose-dependent increase in insulin secretion observed in response to 2-MeSADP (10 μM) and Up3U (10 μM) was evaluated under increasing concentrations of glucose in MIN6 cells. Insulin secretion by both 2-MeSADP and Up3U was significantly increased in the presence of higher glucose concentrations compared with 5 mM glucose concentration. Data represent mean±s.e.m, n=3. Analysis of results was performed by ANOVA, followed by Tukey-Kramer multiple comparison test. *P<0.05 when compared to control; aP<0.05 when compared to 10 μM 2-MeSADP; bP<0.05 when compared to 10 μM Up3U.
Figure 5
Figure 5
The functional response in MIN6 cells to P2Y1 and P2Y6 receptor agonists, 2-MeSADP and Up3U, respectively. Activation of PLC by Gq-coupled P2Y1 and P2Y6 receptors lead to significant accumulation of intracellular IP3 (A) and intracellular calcium (B) in MIN6 cells. EC50 (nM) values for accumulation of intracellular IP3 were: 2-MeSADP (EC50 = 11.7±1.2) and Up3U (EC50 = 29±7.3). Data represent mean±s.e.m, n=3.
Figure 5
Figure 5
The functional response in MIN6 cells to P2Y1 and P2Y6 receptor agonists, 2-MeSADP and Up3U, respectively. Activation of PLC by Gq-coupled P2Y1 and P2Y6 receptors lead to significant accumulation of intracellular IP3 (A) and intracellular calcium (B) in MIN6 cells. EC50 (nM) values for accumulation of intracellular IP3 were: 2-MeSADP (EC50 = 11.7±1.2) and Up3U (EC50 = 29±7.3). Data represent mean±s.e.m, n=3.
Figure 6
Figure 6
MIN6 cells were pretreated with either 2-MeSADP or Up3U and apoptosis was induced by treatment with TNF-α (50 ng/ml). After 24 h, cells were stained with HO342 and PI. Fluorescence micrographs of: (A) control cells; (B) MIN6 cells treated with TNF-α showing apoptosis; (C) MIN6 cells treated with Up3U + TNF-α showing significant cytoprotection; (D) MIN6 cells treated with 2-MeSADP + TNF-α with no apparent changes when compared to (B). Bars shown indicate 50 μm.
Figure 7
Figure 7
Cytoprotective effect of Up3U against TNF-α induced cell death was determined using flow cytometry. MIN6 cells were cultured in the absence or presence of TNF-α (50 ng/ml) either alone or in the presence of Up3U or 2-MeSADP for 24 h. The percentage of cells displaying sub-G1 quantities of DNA was determined using a FACS Calibur. Representative FACS histograms are shown with horizontal bars indicating the gate setting (M1) used to detect sub-G1 (apoptotic) cells. (B) Data represent mean±s.e.m, n=3. Analysis of results was performed by ANOVA, followed by Tukey-Kramer multiple comparison test. *P<0.05 when compared to control; aP<0.05 when compared to TNF-α.
Figure 7
Figure 7
Cytoprotective effect of Up3U against TNF-α induced cell death was determined using flow cytometry. MIN6 cells were cultured in the absence or presence of TNF-α (50 ng/ml) either alone or in the presence of Up3U or 2-MeSADP for 24 h. The percentage of cells displaying sub-G1 quantities of DNA was determined using a FACS Calibur. Representative FACS histograms are shown with horizontal bars indicating the gate setting (M1) used to detect sub-G1 (apoptotic) cells. (B) Data represent mean±s.e.m, n=3. Analysis of results was performed by ANOVA, followed by Tukey-Kramer multiple comparison test. *P<0.05 when compared to control; aP<0.05 when compared to TNF-α.

Similar articles

Cited by

References

    1. Burnstock G, Williams M. P2 purinergic receptors: modulation of cell function and therapeutic potential. J Pharmacol Exp Ther. 2000;295:862–9. - PubMed
    1. Burnstock G. Physiological and pathological roles of purines: an update. Drug Dev Res. 1998;28:195–206.
    1. Ralevic V, Burnstock G. Receptors for purines and pyrimidines. Pharmacol Rev. 1998;50:413–92. - PubMed
    1. Abbracchio MP, Saffrey MJ, Hopker V, Burnstock G. Modulation of astroglial cell proliferation by analogues of adenosine and ATP in primary cultures of rat striatum. Neuroscience. 1994;59:67–76. - PubMed
    1. Van Kolen K, Slegers H. Integration of P2Y receptor-activated signal transduction pathways in G protein-dependent signalling networks. Purinergic Signal. 2006;2:451–69. - PMC - PubMed

Publication types

MeSH terms