Mesenchymal cells stimulate capillary morphogenesis via distinct proteolytic mechanisms
- PMID: 20067788
- PMCID: PMC2845480
- DOI: 10.1016/j.yexcr.2010.01.013
Mesenchymal cells stimulate capillary morphogenesis via distinct proteolytic mechanisms
Abstract
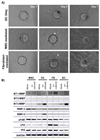
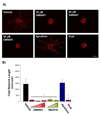
During angiogenesis, endothelial cells (ECs) degrade their surrounding extracellular matrix (ECM) to facilitate invasion. How interactions between ECs and other cells within their microenvironment facilitate this process is only partially understood. We have utilized a tractable 3D co-culture model to investigate the proteolytic mechanisms by which pre-committed or more highly committed mesenchymal cells stimulate capillary formation. On their own, ECs invade their surrounding matrix, but do not form capillaries. However, in the presence of either mesenchymal stem cells (MSCs) or fibroblasts, ECs form polarized, tubular structures that are intimately associated with mesenchymal cells. Further, ECs up-regulate gene expression of several extracellular proteases upon co-culture with either mesenchymal cell type. The administration of both broad spectrum and specific protease inhibitors demonstrated that MSC-stimulated capillary formation relied solely on membrane-type matrix metalloproteinases (MT-MMPs) while fibroblast-mediated sprouting proceeded independent of MMP inhibition unless the plasminogen activator/plasmin axis was inhibited in concert. While other studies have established a role for the ECM itself in dictating proteolysis and matrix degradation during capillary morphogenesis, the present study illustrates that heterotypic cellular interactions within the microenvironment can direct the proteolytic mechanisms required for capillary formation.
2009 Elsevier Inc. All rights reserved.
Figures


Similar articles
-
Mesenchymal stem cells from adipose and bone marrow promote angiogenesis via distinct cytokine and protease expression mechanisms.Angiogenesis. 2011 Mar;14(1):47-59. doi: 10.1007/s10456-010-9194-9. Epub 2010 Nov 21. Angiogenesis. 2011. PMID: 21104120 Free PMC article.
-
Deciphering the relative roles of matrix metalloproteinase- and plasmin-mediated matrix degradation during capillary morphogenesis using engineered hydrogels.J Biomed Mater Res B Appl Biomater. 2019 Nov;107(8):2507-2516. doi: 10.1002/jbm.b.34341. Epub 2019 Feb 19. J Biomed Mater Res B Appl Biomater. 2019. PMID: 30784190 Free PMC article.
-
Extracellular matrix deposition by fibroblasts is necessary to promote capillary-like tube formation in vitro.J Cell Physiol. 2006 May;207(2):491-8. doi: 10.1002/jcp.20584. J Cell Physiol. 2006. PMID: 16453301
-
Molecular control of capillary morphogenesis and maturation by recognition and remodeling of the extracellular matrix: functional roles of endothelial cells and pericytes in health and disease.Connect Tissue Res. 2015;56(5):392-402. doi: 10.3109/03008207.2015.1066781. Epub 2015 Aug 25. Connect Tissue Res. 2015. PMID: 26305158 Free PMC article. Review.
-
Endothelial extracellular matrix: biosynthesis, remodeling, and functions during vascular morphogenesis and neovessel stabilization.Circ Res. 2005 Nov 25;97(11):1093-107. doi: 10.1161/01.RES.0000191547.64391.e3. Circ Res. 2005. PMID: 16306453 Review.
Cited by
-
The dual effect of mesenchymal stem cells on tumour growth and tumour angiogenesis.Stem Cell Res Ther. 2013 Apr 29;4(2):41. doi: 10.1186/scrt195. Stem Cell Res Ther. 2013. PMID: 23628074 Free PMC article.
-
Quantifying the Vasculogenic Potential of Induced Pluripotent Stem Cell-Derived Endothelial Progenitors in Collagen Hydrogels.Tissue Eng Part A. 2019 May;25(9-10):746-758. doi: 10.1089/ten.TEA.2018.0274. Epub 2019 May 2. Tissue Eng Part A. 2019. PMID: 30618333 Free PMC article.
-
MSC-Derived Extracellular Vesicles in Tumors and Therapy.Cancers (Basel). 2021 Oct 18;13(20):5212. doi: 10.3390/cancers13205212. Cancers (Basel). 2021. PMID: 34680359 Free PMC article. Review.
-
In vitro biomaterial priming of human mesenchymal stromal/stem cells : implication of the Src/JAK/STAT3 pathway in vasculogenic mimicry.Sci Rep. 2024 Sep 13;14(1):21444. doi: 10.1038/s41598-024-72862-6. Sci Rep. 2024. PMID: 39271790 Free PMC article.
-
Controlled delivery of basic fibroblast growth factor (bFGF) using acoustic droplet vaporization stimulates endothelial network formation.Acta Biomater. 2019 Oct 1;97:409-419. doi: 10.1016/j.actbio.2019.08.016. Epub 2019 Aug 9. Acta Biomater. 2019. PMID: 31404713 Free PMC article.
References
-
- Jain RK. Molecular regulation of vessel maturation. Nat Med. 2003;9:685–693. - PubMed
-
- Griffith LG, Naughton G. Tissue engineering--current challenges and expanding opportunities. Science. 2002;295:1009–1014. - PubMed
-
- Folkman J. Angiogenesis in cancer, vascular, rheumatoid and other disease. Nat Med. 1995;1:27–31. - PubMed
-
- Dolberg DS, Bissell MJ. Inability of Rous sarcoma virus to cause sarcomas in the avian embryo. Nature. 1984;309:552–556. - PubMed
Publication types
MeSH terms
Substances
Grants and funding
LinkOut - more resources
Full Text Sources
Other Literature Sources

