

Prevalence of diabetes and high risk for diabetes using A1C criteria in the U.S. population in 1988-2006
- PMID: 20067953
- PMCID: PMC2827508
- DOI: 10.2337/dc09-1524
Prevalence of diabetes and high risk for diabetes using A1C criteria in the U.S. population in 1988-2006
Abstract
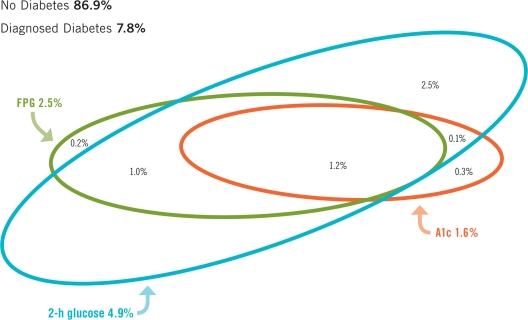
OBJECTIVE We examined prevalences of previously diagnosed diabetes and undiagnosed diabetes and high risk for diabetes using recently suggested A1C criteria in the U.S. during 2003-2006. We compared these prevalences to those in earlier surveys and those using glucose criteria. RESEARCH DESIGN AND METHODS In 2003-2006, the National Health and Nutrition Examination Survey included a probability sample of 14,611 individuals aged > or =12 years. Participants were classified on glycemic status by interview for diagnosed diabetes and by A1C, fasting, and 2-h glucose challenge values measured in subsamples. RESULTS Using A1C criteria, the crude prevalence of total diabetes in adults aged > or =20 years was 9.6% (20.4 million), of which 19.0% was undiagnosed (7.8% diagnosed, 1.8% undiagnosed using A1C > or =6.5%). Another 3.5% of adults (7.4 million) were at high risk for diabetes (A1C 6.0 to <6.5%). Prevalences were disproportionately high in the elderly. Age-/sex-standardized prevalence was more than two times higher in non-Hispanic blacks and Mexican Americans versus non-Hispanic whites for diagnosed, undiagnosed, and total diabetes (P < 0.003); standardized prevalence at high risk for diabetes was more than two times higher in non-Hispanic blacks versus non-Hispanic whites and Mexican Americans (P < 0.00001). Since 1988-1994, diagnosed diabetes generally increased, while the percent of diabetes that was undiagnosed and the percent at high risk of diabetes generally decreased. Using A1C criteria, prevalences of undiagnosed diabetes and high risk of diabetes were one-third that and one-tenth that, respectively, using glucose criteria. CONCLUSIONS Although A1C detects much lower prevalences than glucose criteria, hyperglycemic conditions remain high in the U.S., and elderly and minority groups are disproportionately affected.
Figures
References
-
- Centers for Disease Control and Prevention, National Center for Health Statistics. National Health and Nutrition Examination Survey 1988–1994, 1999–2002, 2003–2006 [information online], 2009. Available from http://www.cdc.gov/nchs/nhanes/about_nhanes.htm. Accessed 1 March 2009
-
- Little RR, Wiedmeyer HM, England JD, Wilke AL, Rohlfing CL, Wians FH, Jr, Jacobson JM, Zellmer V, Goldstein DE: Interlaboratory standardization of measurements of glycohemoglobins. Clin Chem 1992;38:2472–2478 - PubMed
-
- U.S. Census Bureau, Population Division. Table 1: annual estimates of the population by five-year age groups and sex for the United States: April 1, 2000 to July 1, 2006 (NC-EST2006-01) [information online], 2003–2006. Available from www.census.gov/popest/national/asrh/NC-EST2006-sa.html.data. Accessed 17 May 2009
MeSH terms
Substances
LinkOut - more resources
Full Text Sources
Other Literature Sources
Medical
