. 2010 Apr;33(4):861-8.
doi: 10.2337/dc09-1799. Epub 2010 Jan 12.

Increased toll-like receptor (TLR) activation and TLR ligands in recently diagnosed type 2 diabetic subjects

Affiliations

Increased toll-like receptor (TLR) activation and TLR ligands in recently diagnosed type 2 diabetic subjects

Mohan R Dasu et al. Diabetes Care. 2010 Apr.

Abstract

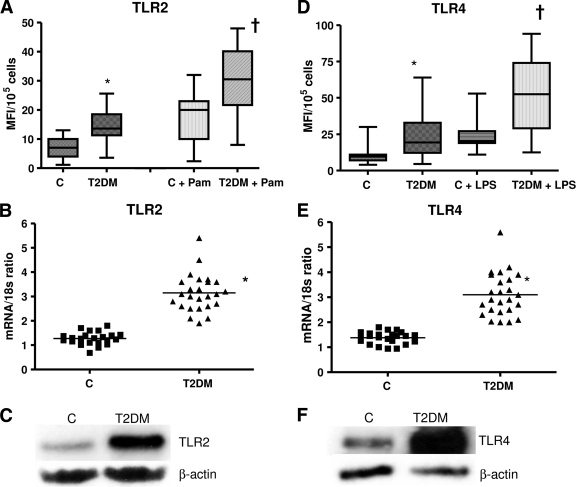
Objective: Individuals with type 2 diabetes have a myriad of metabolic aberrations including increased inflammation, increasing their cardiovascular risk. Toll-like receptors (TLRs) and their ligands play a key role in insulin resistance and atherosclerosis. However, there is a paucity of data examining the expression and activity of TLRs in type 2 diabetes. Thus, in the present study, we examined TLR2 and TLR4 mRNA and protein expression, their ligands, and signaling in monocytes of recently diagnosed type 2 diabetic patients.

Research design and methods: TLR mRNA, protein expression, TLR ligands, and TLR signaling were measured in freshly isolated monocytes from healthy human control subjects (n = 23) and type 2 diabetic subjects (n = 23) using real-time RT-PCR, Western blot, and flow cytometric assays.

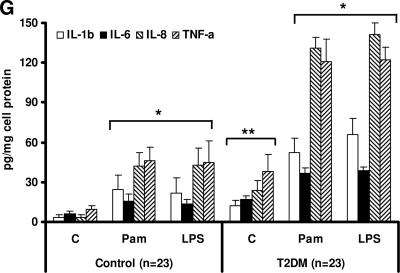
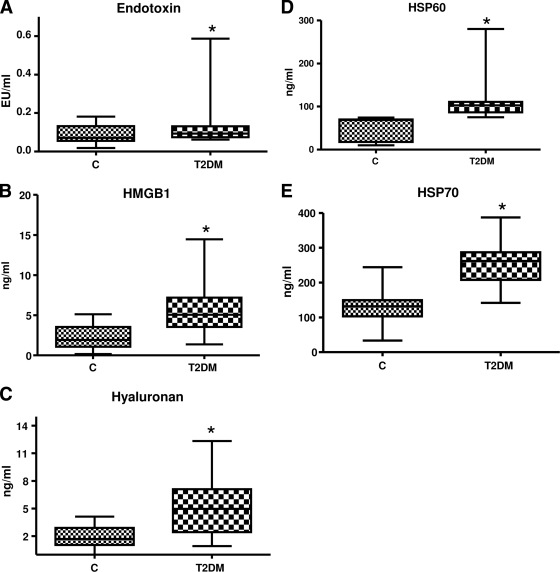
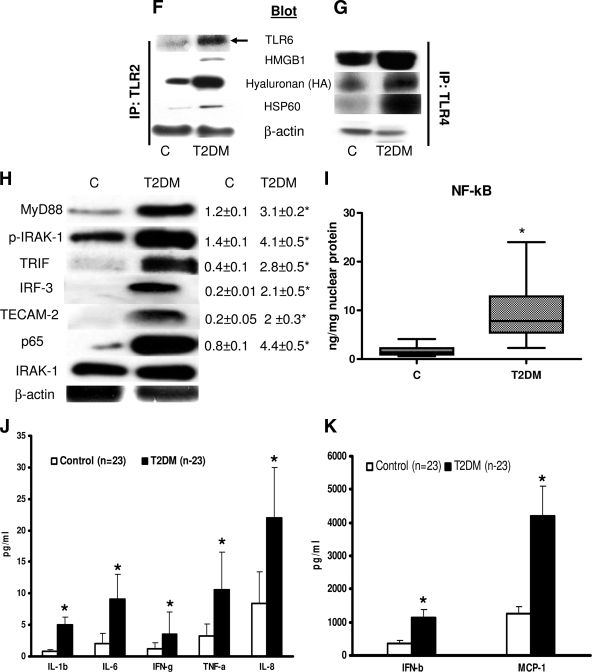
Results: Type 2 diabetic subjects had significantly increased TLR2, TLR4 mRNA, and protein in monocytes compared with control subjects (P < 0.05). Increased TLR2 and TLR4 expression correlated with BMI, homeostasis model assessment-insulin resistance (HOMA-IR), glucose, A1C, N(epsilon)-(carboxymethyl) lysine (CML), and free fatty acid (FFA). Ligands of TLR2 and TLR4, namely, HSP60, HSP70, HMGB1, endotoxin, and hyaluronan levels, were elevated in type 2 diabetic subjects and positively correlated with TLR2 and TLR4. Type 2 diabetic subjects showed increased MyD88, phosphorylated IRAK-1, Trif, TICAM-1, IRF-3, and NF-kappaB p65 expression in monocytes compared with control subjects. Furthermore, TLR-MyD88-NF-kappaB signaling resulted in elevated levels of cytokines (P < 0.05), but increased interleukin (IL)-1beta, interferon (IFN)-gamma, and endotoxin were not significant when adjusted for BMI.

Conclusions: In this comprehensive study, we make the novel observation that TLR2 and TLR4 expression and their ligands, signaling, and functional activation are increased in recently diagnosed type 2 diabetes and contribute to the proinflammatory state.


Figures

Figure 1
Figure 1
TLR protein and mRNA content. A: TLR2 surface protein expression was measured in monocytes after Pam3CSK4 (Pam) challenge in control (n = 23) and type 2 diabetic (n = 23) subjects by flow cytometry as described in research design and methods. Values are expressed as mean fluorescence intensity units (MFI)/105 cells. *P < 0.005 vs. control; P < 0.05 versus C+Pam. C, control; T2DM, type 2 diabetes. B: Monocyte TLR2 mRNA expression ratios in control (n = 23) and type 2 diabetes (n = 23) subjects by real-time RT-PCR as described in research design and methods. 18s mRNA is used as the housekeeping gene. Values are expressed as mean ratio ± SD. *P < 0.001 vs. control. C: Representative Western blot depicting the TLR2 protein expression in pooled resting monocytes from three control subjects and three type 2 diabetic subjects. β-Actin was used as a loading control as described in research design and methods. Each assay is repeated four times. D: TLR4 surface protein expression was measured in monocytes after LPS challenge in control (n = 23) and type 2 diabetic (n = 23) subjects by flow cytometry as described in research design and methods. Values are expressed as mean fluorescence intensity units (MFI)/105 cells. *P < 0.005 vs. control; P < 0.05 vs. C + LPS. E: Monocyte TLR4 mRNA expression ratios in control (n = 23) and type 2 diabetic (n = 23) subjects by real-time RT-PCR as described in research design and methods. 18s mRNA is used as the housekeeping gene. Values are expressed as mean ratio ± SD. *P < 0.005 vs. control. F: Representative Western blot depicting the TLR4 protein expression in pooled resting monocytes from three control and three type 2 diabetic subjects. β-Actin was used as a loading control as described in research design and methods. Each assay is repeated four times. G: Release of cytokines in resting and activated monocyte cell culture supernatants from control and type 2 diabetic subjects using Multiplex assay as described in research design and methods. Values are expressed as pg/mg cell protein. *P < 0.001 vs. untreated C; **P < 0.005 vs. control (healthy control). C, untreated; LPS, lipopolysaccharide, TLR4 ligand; Pam, Pam3CSK4, synthetic TLR2 ligand.
Figure 1
Figure 1
TLR protein and mRNA content. A: TLR2 surface protein expression was measured in monocytes after Pam3CSK4 (Pam) challenge in control (n = 23) and type 2 diabetic (n = 23) subjects by flow cytometry as described in research design and methods. Values are expressed as mean fluorescence intensity units (MFI)/105 cells. *P < 0.005 vs. control; P < 0.05 versus C+Pam. C, control; T2DM, type 2 diabetes. B: Monocyte TLR2 mRNA expression ratios in control (n = 23) and type 2 diabetes (n = 23) subjects by real-time RT-PCR as described in research design and methods. 18s mRNA is used as the housekeeping gene. Values are expressed as mean ratio ± SD. *P < 0.001 vs. control. C: Representative Western blot depicting the TLR2 protein expression in pooled resting monocytes from three control subjects and three type 2 diabetic subjects. β-Actin was used as a loading control as described in research design and methods. Each assay is repeated four times. D: TLR4 surface protein expression was measured in monocytes after LPS challenge in control (n = 23) and type 2 diabetic (n = 23) subjects by flow cytometry as described in research design and methods. Values are expressed as mean fluorescence intensity units (MFI)/105 cells. *P < 0.005 vs. control; P < 0.05 vs. C + LPS. E: Monocyte TLR4 mRNA expression ratios in control (n = 23) and type 2 diabetic (n = 23) subjects by real-time RT-PCR as described in research design and methods. 18s mRNA is used as the housekeeping gene. Values are expressed as mean ratio ± SD. *P < 0.005 vs. control. F: Representative Western blot depicting the TLR4 protein expression in pooled resting monocytes from three control and three type 2 diabetic subjects. β-Actin was used as a loading control as described in research design and methods. Each assay is repeated four times. G: Release of cytokines in resting and activated monocyte cell culture supernatants from control and type 2 diabetic subjects using Multiplex assay as described in research design and methods. Values are expressed as pg/mg cell protein. *P < 0.001 vs. untreated C; **P < 0.005 vs. control (healthy control). C, untreated; LPS, lipopolysaccharide, TLR4 ligand; Pam, Pam3CSK4, synthetic TLR2 ligand.
Figure 2
Figure 2
A: Endotoxin concentration in control (n = 23) and type 2 diabetic (n = 23) subjects was measured using Limulus Ameobocyte lysate assay as described in research design and methods. Values are expressed as EU/ml. *P < 0.05 vs. control. C, control; T2DM, type 2 diabetes. B: HMGB1 concentration in control (n = 23) and type 2 diabetic (n = 23) subjects was measured using ELISA as described in research design and methods. Values are expressed as ng/ml. *P < 0.0001 vs. control. C: Hyaluronan concentration in control (n = 23) and type 2 diabetic (n = 23) subjects was measured using ELISA as described in research design and methods. Values are expressed as ng/ml. *P < 0.0001 vs. control. D: HSP60 concentration in control (n = 23) and type 2 diabetes (n = 23) subjects was measured using ELISA as described in research design and methods. Values are expressed as ng/ml. *P < 0.0001 vs. control. E: HSP70 concentration in control (n = 23) and type 2 diabetic (n = 23) subjects was measured using ELISA as described in research design and methods. Values are expressed as ng/ml. *P < 0.0001 vs. control. F: Association of TLR2 with its ligands and TLR6. Representative Western blot showing enhanced expression of TLR6, HMGB1, hyaluronan, and HSP60 in basal control and type 2 diabetes monocyte cell lysates immunoprecipitated with TLR2 antibody as detailed in research design and methods. β-Actin was used as a loading control. Each assay is repeated four times. IP, immunoprecipitation. G: Association of TLR4 with its ligands. Representative Western blot showing enhanced expression of HMGB1, hyaluronan, and HSP60 in basal control and type 2 diabetes monocyte cell lysates immunoprecipitated with TLR4 antibody as detailed in research design and methods. β-Actin was used as a loading control. Each assay is repeated four times. H: Monocyte TLR signaling in the basal state. TLR downstream signaling proteins MyD88, pIRAK-1, Trif, IRF-3, TECAM-2, and NF-κB p65 were performed using specific antibodies to the respective (phospho) proteins, as described in research design and methods using β-actin as a loading and internal control for MyD88, Trif, IRF-3, TECAM-2, and NF-κB p65 and IRAK for pIRAK-1. Each blot is repeated four times with pooled monocytes from three subjects. Densitometric ratios corroborate the data. *P < 0.05 vs. control. I: The DNA binding activity of nuclear NF-κB p65 in control (n = 23) and type 2 diabetes (n = 23) monocytes was assessed by ELISA as detailed in research design and methods in the basal state. Values are normalized to milligram nuclear protein and expressed as mean ± SD. *P < 0.05 vs. control. J: Serum concentration of cytokines/chemokines in study subjects were measured using Multiplex assays as described in research design and methods. Values are expressed as picograms per milliliter. *P < 0.0001 vs. control. K: Serum concentration of cytokines/chemokines in study subjects were measured using Multiplex assays as described in research design and methods. Values are expressed as picograms per milliliter. *P < 0.0001 vs. control.
Figure 2
Figure 2
A: Endotoxin concentration in control (n = 23) and type 2 diabetic (n = 23) subjects was measured using Limulus Ameobocyte lysate assay as described in research design and methods. Values are expressed as EU/ml. *P < 0.05 vs. control. C, control; T2DM, type 2 diabetes. B: HMGB1 concentration in control (n = 23) and type 2 diabetic (n = 23) subjects was measured using ELISA as described in research design and methods. Values are expressed as ng/ml. *P < 0.0001 vs. control. C: Hyaluronan concentration in control (n = 23) and type 2 diabetic (n = 23) subjects was measured using ELISA as described in research design and methods. Values are expressed as ng/ml. *P < 0.0001 vs. control. D: HSP60 concentration in control (n = 23) and type 2 diabetes (n = 23) subjects was measured using ELISA as described in research design and methods. Values are expressed as ng/ml. *P < 0.0001 vs. control. E: HSP70 concentration in control (n = 23) and type 2 diabetic (n = 23) subjects was measured using ELISA as described in research design and methods. Values are expressed as ng/ml. *P < 0.0001 vs. control. F: Association of TLR2 with its ligands and TLR6. Representative Western blot showing enhanced expression of TLR6, HMGB1, hyaluronan, and HSP60 in basal control and type 2 diabetes monocyte cell lysates immunoprecipitated with TLR2 antibody as detailed in research design and methods. β-Actin was used as a loading control. Each assay is repeated four times. IP, immunoprecipitation. G: Association of TLR4 with its ligands. Representative Western blot showing enhanced expression of HMGB1, hyaluronan, and HSP60 in basal control and type 2 diabetes monocyte cell lysates immunoprecipitated with TLR4 antibody as detailed in research design and methods. β-Actin was used as a loading control. Each assay is repeated four times. H: Monocyte TLR signaling in the basal state. TLR downstream signaling proteins MyD88, pIRAK-1, Trif, IRF-3, TECAM-2, and NF-κB p65 were performed using specific antibodies to the respective (phospho) proteins, as described in research design and methods using β-actin as a loading and internal control for MyD88, Trif, IRF-3, TECAM-2, and NF-κB p65 and IRAK for pIRAK-1. Each blot is repeated four times with pooled monocytes from three subjects. Densitometric ratios corroborate the data. *P < 0.05 vs. control. I: The DNA binding activity of nuclear NF-κB p65 in control (n = 23) and type 2 diabetes (n = 23) monocytes was assessed by ELISA as detailed in research design and methods in the basal state. Values are normalized to milligram nuclear protein and expressed as mean ± SD. *P < 0.05 vs. control. J: Serum concentration of cytokines/chemokines in study subjects were measured using Multiplex assays as described in research design and methods. Values are expressed as picograms per milliliter. *P < 0.0001 vs. control. K: Serum concentration of cytokines/chemokines in study subjects were measured using Multiplex assays as described in research design and methods. Values are expressed as picograms per milliliter. *P < 0.0001 vs. control.

References

    1. Haffner SM, Lehto S, Rönnemaa T, Pyörälä K, Laakso M. Mortality from coronary heart disease in subjects with type 2 diabetes and in nondiabetic subjects with and without prior myocardial infarction. N Engl J Med 1998;339:229–234 - PubMed
    1. Yan SF, Ramasamy R, Schmidt AM. Mechanisms of disease: advanced glycation end-products and their receptor in inflammation and diabetes complications. Nat Clin Pract Endocrinol Metab 2008;4:285–293 - PubMed
    1. Dasu MR, Devaraj S, Zhao L, Hwang DH, Jialal I. High glucose induces toll-like receptor expression in human monocytes: mechanism of activation. Diabetes 2008;57:3090–3098 - PMC - PubMed
    1. Wellen KE, Hotamisligil GS. Inflammation, stress, and diabetes. J Clin Invest 2005;115:1111–1119 - PMC - PubMed
    1. Shi H, Kokoeva MV, Inouye K, Tzameli I, Yin H, Flier JS. TLR4 links innate immunity and fatty acid-induced insulin resistance. J Clin Invest 2006;116:3015–3025 - PMC - PubMed

Publication types

MeSH terms