

Diabetes trends among delivery hospitalizations in the U.S., 1994-2004
- PMID: 20067968
- PMCID: PMC2845025
- DOI: 10.2337/dc09-1801
Diabetes trends among delivery hospitalizations in the U.S., 1994-2004
Abstract
Objective: To examine trends in the prevalence of diabetes among delivery hospitalizations in the U.S. and to describe the characteristics of these hospitalizations.
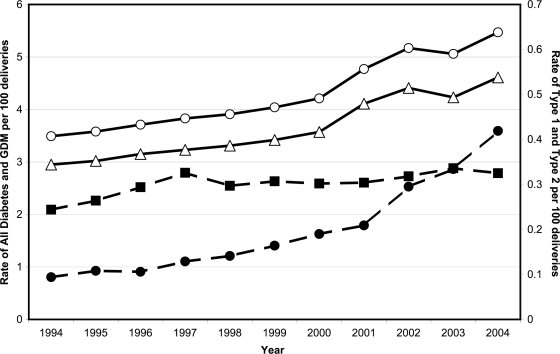
Research design and methods: Hospital discharge data from 1994 through 2004 were obtained from the Nationwide Inpatient Sample. Diagnosis codes were selected for gestational diabetes mellitus (GDM), type 1 diabetes, type 2 diabetes, and unspecified diabetes. Rates of delivery hospitalization with diabetes were calculated per 100 deliveries.
Results: Overall, an estimated 1,863,746 hospital delivery discharges contained a diabetes diagnosis, corresponding to a rate of 4.3 per 100 deliveries over the 11-year period. GDM accounted for the largest proportion of delivery hospitalizations with diabetes (84.7%), followed by type 1 (7%), type 2 (4.7%), and unspecified diabetes (3.6%). From 1994 to 2004, the rates for all diabetes, GDM, type 1 diabetes, and type 2 diabetes significantly increased overall and within each age-group (15-24, 25-34, and > or =35 years) (P < 0.05). The largest percent increase for all ages was among type 2 diabetes (367%). By age-group, the greatest percent increases for each diabetes type were among the two younger groups. Significant predictors of diabetes at delivery included age > or =35 years vs. 15-24 years (odds ratio 4.80 [95% CI 4.72-4.89]), urban versus rural location (1.14 [1.11-1.17]), and Medicaid/Medicare versus other payment sources (1.29 [1.26-1.32]).
Conclusions: Given the increasing prevalence of diabetes among delivery hospitalizations, particularly among younger women, it will be important to monitor trends in the pregnant population and target strategies to minimize risk for maternal/fetal complications.
Figures
References
-
- Schaefer-Graf UM, Buchanan TA, Xiang A, Songster G, Montoro M, Kjos SL. Patterns of congenital anomalies and relationship to initial maternal fasting glucose levels in pregnancies complicated by type 2 and gestational diabetes. Am J Obstet Gynecol 2000;182:313–320 - PubMed
-
- American College of Obstetricians and Gynecologists. ACOG Practice Bulletin. Clinical management guidelines for obstetrician-gynecologists. Number 60, March 2005. Pregestational diabetes mellitus. Obstet Gynecol 2005;105:675–685 - PubMed
-
- Coustan DR. Gestational diabetes. In Diabetes in America. 2nd ed. National Diabetes Data Group. Bethesda, MD, National Institute of Diabetes and Digestive and Kidney Diseases, 1995, p. 703–717 (NIH publ. no. 95–1468)
-
- American College of Obstetricians and Gynecologists. ACOG Practice Bulletin. Clinical management guidelines for obstetrician-gynecologists. Number 30, September 2001. Gestational diabetes. Obstet Gynecol 2001;98:525–538 - PubMed
-
- Ferrara A, Kahn HS, Quesenberry CP, Riley C, Hedderson MM. An increase in the incidence of gestational diabetes mellitus: Northern California, 1991–2000. Obstet Gynecol 2004;103:526–533 - PubMed
MeSH terms
LinkOut - more resources
Full Text Sources
Medical
