. 2010 Feb 1;123(Pt 3):460-71.
doi: 10.1242/jcs.055103. Epub 2010 Jan 12.

Functional characterization of protein-sorting machineries at the trans-Golgi network in Drosophila melanogaster

Affiliations

Functional characterization of protein-sorting machineries at the trans-Golgi network in Drosophila melanogaster

Satoshi Kametaka et al. J Cell Sci. .

Abstract

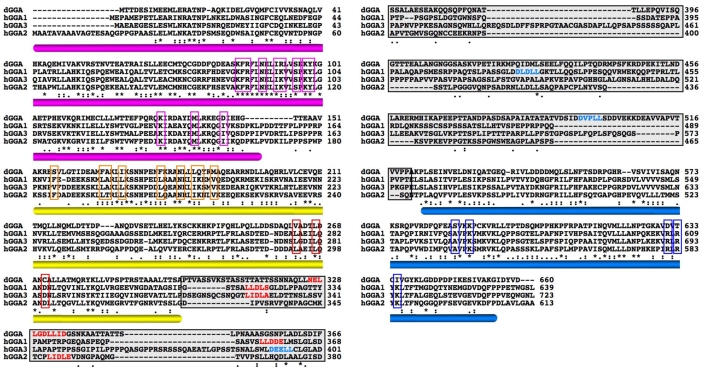
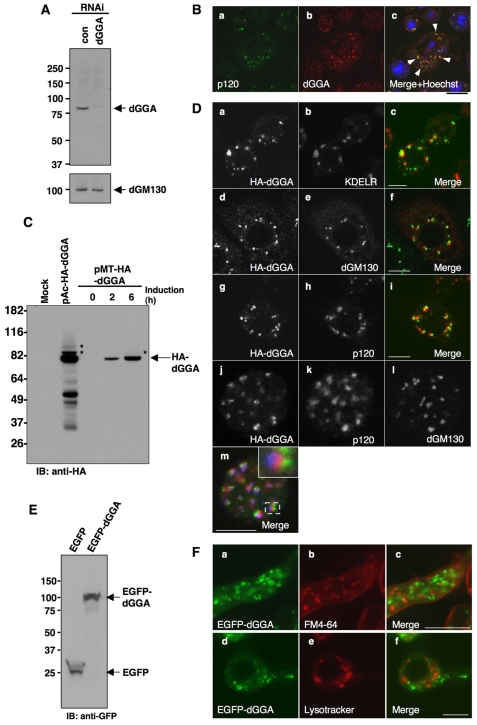
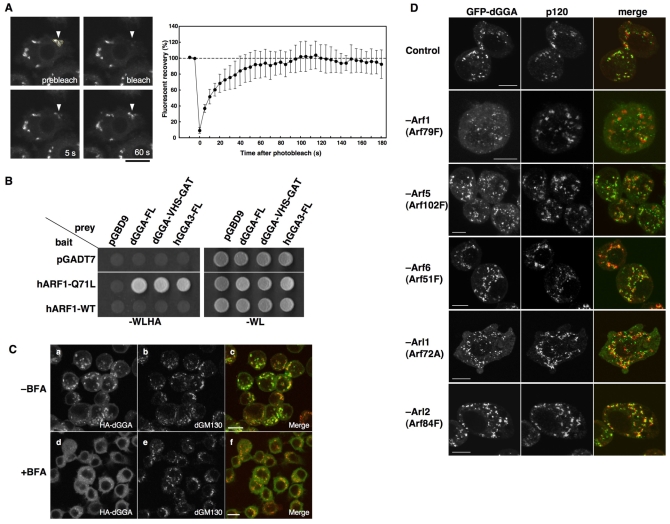
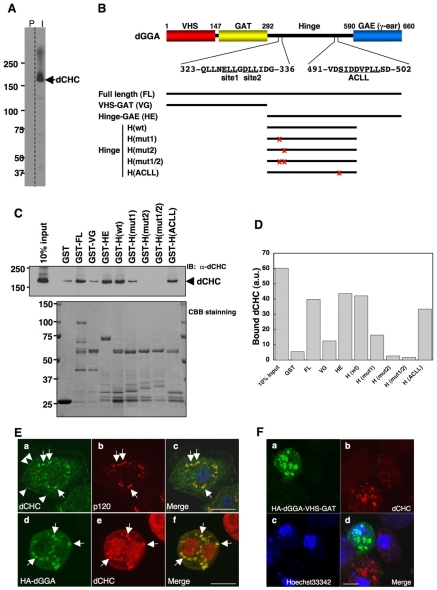
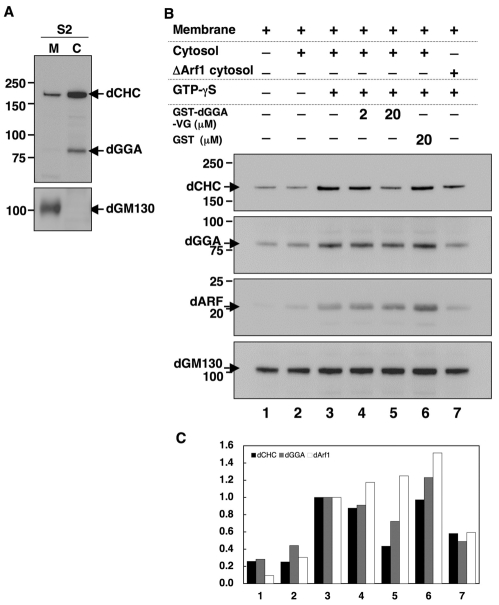
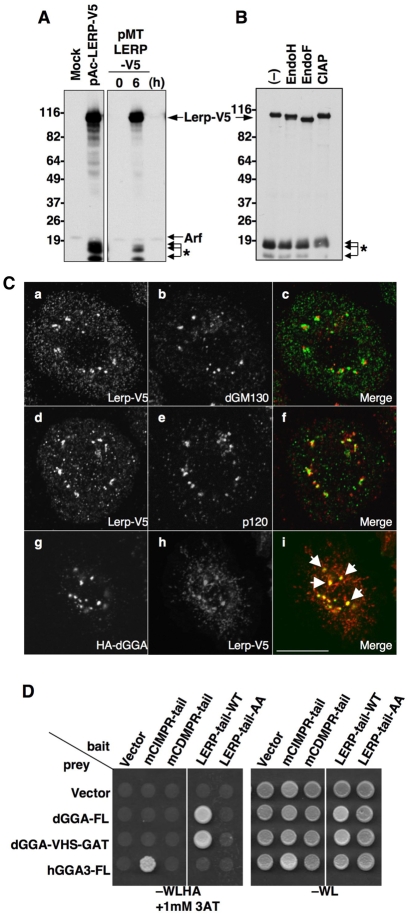
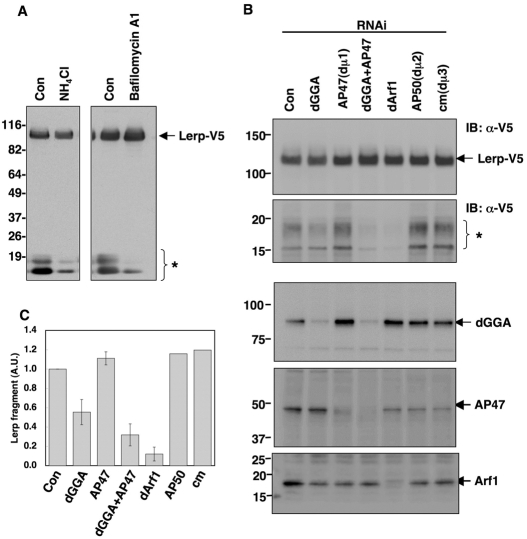
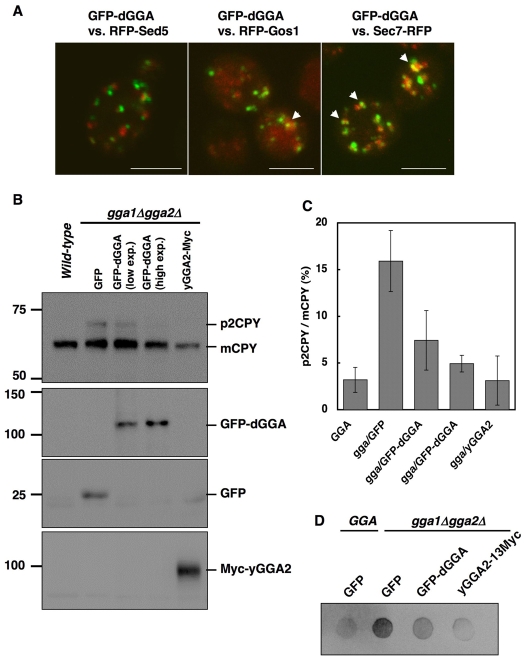
Targeting of proteins to their final destination is a prerequisite for living cells to maintain their homeostasis. Clathrin functions as a coat that forms transport carriers called clathrin-coated vesicles (CCVs) at the plasma membrane and post-Golgi compartments. In this study, we established an experimental system using Schneider S2 cells derived from the fruit fly, Drosophila melanogaster, as a model system to study the physiological roles of clathrin adaptors, and to dissect the processes of CCV formation. We found that a clathrin adaptor Drosophila GGA (dGGA), a homolog of mammalian GGA proteins, localizes to the trans-Golgi network (TGN) and is capable of recruiting clathrin from the cytosol onto TGN membranes. dGGA itself is recruited from the cytosol to the TGN in an ARF1 small GTPase (dARF79F)-dependent manner. dGGA recognizes the cytoplasmic acidic-cluster-dileucine (ACLL) sorting signal of Lerp (lysosomal enzyme receptor protein), a homolog of mammalian mannose 6-phosphate receptors. Moreover, both dGGA and another type of TGN-localized clathrin adaptor, AP-1 (adaptor protein-1 complex), are shown to be involved in the trafficking of Lerp from the TGN to endosomes and/or lysosomes. Taken together, our findings indicate that the protein-sorting machinery in fly cells is well conserved relative to that in mammals, enabling the use of fly cells to dissect CCV biogenesis and clathrin-dependent protein trafficking at the TGN of higher eukaryotes.


Figures

Fig. 1.
Fig. 1.
Alignment of amino acid sequences of dGGA and three human GGAs. The deduced amino acid sequences of dGGA and hGGAs 1-3 were aligned using the ClustalW program. The regions with purple, yellow and blue underbars indicate VHS, GAT and GAE domains, respectively. Open boxes colored in purple, orange, red and blue indicate amino acid residues involved in the interaction of hGGA1 with ACLL motif, ARF1, ubiquitin and accessory molecules, respectively. The letters in red are putative clathrin-binding motifs and those in blue indicate putative internal dileucine motifs. The ‘*’, ‘:’ and ‘.’ characters indicate positions with fully, strongly and weakly conserved residues, respectively (more detailed information is available at http://align.genome.jp/clustalw/).
Fig. 2.
Fig. 2.
Localization of endogenous dGGA, HA-dGGA and EGFP-dGGA in S2 cells. (A) Detection of endogenous dGGA. S2 cell lysate prepared from untreated (con) and treated with siRNA for dGGA (dGGA) was subjected to immunoblotting with anti-dGGA antibody. dGM130 was used as a loading control. (B) S2 cells were co-stained with the anti-dGGA (Bb, red) and anti-p120 (Ba, green) antibodies. Arrows (Bc) indicate the dGGA foci associated with p120-positive Golgi compartment. Nuclei were counter-stained with Hoechst 33342 in Bc (blue). (C) HA-dGGA expressed in S2 cells. S2 cells were transiently transfected with pAc-HA-dGGA or pMT-HA-dGGA. HA-dGGA expression from the pMT-HA-dGGA was induced with 0.5 mM CuSO4 for the indicated time (hours). Total cell lysates prepared from these cells were subjected to immunoblotting with anti-HA. (D) Localization of HA-dGGA (Da,c,d,f,g,i,j,m: green in merged images) was compared with KDEL receptor (KDELR: ER and cis-Golgi marker) (Db and red in Dc); dGM130 (cis-Golgi marker) (De, red in Df,l and blue in Dm); and p120 (medial-Golgi marker) (Dh, red in Di,k and red in Dm). The typical set of triple-labeled stack of Golgi is shown in the inset of Dm. (E) EGFP-dGGA expressed in S2 cells. Lysate prepared from S2 cells transiently expressing EGFP or EGFP-dGGA was subjected to immunoblotting with anti-GFP antibody. (F) Colocalization analysis of EGFP-dGGA with endosomal and/or lysosomal markers. S2 cells stably expressing EGFP-dGGA (green) were stained with FM4-64 (Fa-c) for 30 minutes or Lysotracker (Fd-f) for 5 minutes at 25°C. Endosomal compartments labeled with FM4-64 (Fb,c), and Lysotracker-positive lysosomes (Fe,f) are shown in red. For A, C and E, numbers on the left indicate the positions of molecular mass markers (in kDa). Scale bars: 10 μm.
Fig. 3.
Fig. 3.
ARF-dependent Golgi localization of dGGA. (A) The kinetics of association of EGFP-dGGA with the Golgi were studied in stably transfected S2 cells by fluorescence recovery after photobleaching (FRAP, left panels). Quantification of the FRAP data from a set of three experiments is shown in the right panel. Values are the mean ± s.d. (B) Interaction between dGGA and human ARF1 was examined by a yeast two-hybrid experiment. (C) S2 cells stably expressing HA-dGGA were treated with 2 μg/ml BFA for 1 minute and co-stained with anti-HA (Ba,d, green in Bc,f) and anti-dGM130 (Bb,e, red in Bc,f) antibodies. Scale bars: 10 μm. (D) Effect of ARF protein depletion on EGFP-dGGA localization. S2 cells stably expressing EGFP-dGGA (left column) were mock-treated or treated with dsRNA for ARF79F, ARF102F, ARF51F, ARF72A and ARF84F. They were stained with anti-p120 antibody (middle column). Merged images are shown in the right column (green, EGFP-dGGA; red, p120). Scale bars: 5 μm.
Fig. 4
Fig. 4
Clathrin binding of recombinant dGGA and effect of dGGA-VHS-GAT overexpression in vivo. (A) Generation of anti-dCHC antibody. Total lysate prepared from the S2 cells was subjected to immunoblotting with pre-immune (P) and anti-dCHC (I) sera. (B) Schematic representation of the domains of dGGA. Putative clathrin-binding motifs (site1 and site2) and internal ACLL motif are shown. Domains used for the GST-pulldown experiment are depicted as black bars. Mutation sites are indicated by red x. (C) Pulldown of dCHC with recombinant dGGA proteins. Total lysate prepared from the S2 cells was incubated with 25 μg of GST or GST-fusion proteins (lower panel, CBB stained) and binding proteins were pulled-down with the glutathione Sepharose. Bound proteins were subjected to immunoblotting with anti-dCHC antibody (upper panel). 10% of input was loaded as a positive control. (D) Quantification of bound dCHC to each GST-fusion protein. (E) Localization of dCHC at the trans-Golgi. S2 cells (Ea-c) were stained with anti-dCHC (Ea,c, green) and anti-p120 (Eb,c, red) antibodies. Also, S2 cells transiently expressing HA-dGGA (Ed-f) were stained with anti-HA (Ed,f, green) and anti-dCHC (Ee,f, red) antibodies. (F) S2 cells transiently expressing HA-dGGA-VHS-GAT construct were stained with anti-HA (Fa,d, green) and anti-dCHC (Fb,d, red) antibodies. Nuclear DNA was stained with 1 μg/ml Hoechst 33342 (Fc,d, blue). For A and C, numbers on the left indicate the positions of molecular mass markers (in kDa). Scale bars: 10 μm.
Fig. 5.
Fig. 5.
In vitro reconstitution of clathrin recruitment onto isolated membrane. (A) Subcellular fractionation of dGGA, dCHC and dGM130. The PNS fraction prepared from S2 was separated to membrane (M) and cytosol (C) fractions by ultracentrifugation. Each fraction was subjected to immunoblotting for dCHC and dGGA (upper panel), or dGM130 (lower panel). (B) Isolated membrane was incubated with the cytosol fractions prepared from S2 (lanes 2-6) or from S2 cells depleted of ARF79F (lane 7), plus ATP-regeneration system in the presence or absence of 30 μM of GTP-γS, or with GST or GST-dGGA-VHS-GAT (GST-dGGA-VG) at the indicated concentration. After incubation, membranes in the reaction mixture were precipitated with centrifugation at 20,000 g for 20 minutes and the membrane fractions subjected to immunoblotting with anti-dCHC, anti-dGGA, anti-hARF and anti-dGM130 antibodies. (C) Quantification of the membrane-bound proteins. For each protein, the ratio of the amount in each experimental condition to that in lane 3 was plotted.
Fig. 6.
Fig. 6.
Lerp is a Golgi-localized, glycosylated, transmembrane protein that interacts with dGGA. (A) C-terminal V5-tagged Lerp was expressed in S2 cells from a pAc-Lerp-V5 construct (left panel) or from a pMT-Lerp-V5 construct (right panel) induced with 0.5 mM CuSO4 for the indicated time (hour). The total cell lysates were subjected to immunoblotting with anti-V5 antibody. Asterisks indicate the degradation products of the Lerp-V5, as assessed in Fig. 7. (B) The S2 lysate containing Lerp-V5 was treated with buffer (−), endoglycosidase H (EndoH), PNGase (EndoF) or calf intestine alkaline phosphatase (CIAP), and the mobility shift on SDS-PAGE examined with immunoblotting. (C) Intracellular localization of Lerp-V5 was examined with anti-V5 antibody (green in merged images) together with dGM130 (Ca-c), p120 (Cd-f) and HA-dGGA (Cg-i) as cis-, medial- and trans-Golgi markers (red in merged images), respectively. (D) Molecular interaction between dGGA and the cytoplasmic region of Lerp was assessed with the yeast two-hybrid assay. Numbers on the left indicate the positions of molecular mass markers (in kDa). Scale bars: 10 μm.
Fig. 7.
Fig. 7.
RNAi for dGGA causes delay in Lerp processing in vivo. (A) S2 cells transiently expressing Lerp-V5 were treated with 25 mM NH4Cl or 1 μM Bafilomycin A1 for 12 hours, and Lerp-V5 and its small fragments (asterisks) were detected with anti-V5 antibody. (B) S2 cells transiently expressing pMT-Lerp-V5 were treated with dsRNA for knocking down of each genes indicated for 4 days. After the dsRNA treatment, expression of Lerp-V5 was induced with 0.5 mM CuSO4 for 8 hours, and cellular proteins were subjected to immunoblotting with anti-V5 antibody. Top two panels show the upper and lower area of the same membrane blot, respectively. Numbers on the left indicate the positions of molecular mass markers (in kDa). Asterisks in A and B indicates the degradative fragments of Lerp-V5. (C) Quantification of the Lerp processing. Relative intensity of the Lerp fragments in the knocked-down cells to that of the negative control cells was plotted. The value indicate mean ± s.d. The data presented are representative of three independent experiments.
Fig. 8.
Fig. 8.
Functional complementation of the vps phenotype of gga-deficient yeast by overexpression of dGGA. (A) Distribution of EGFP-dGGA in the yeast. Wild-type (SEY6210) cells were co-transformed with EGFP-dGGA and mRFP-coupled Sed5 (cis-Golgi, left panel), Gos1 (medial-Golgi, center panel) or Sec7 (trans-Golgi, right panel) expression vectors. Confocal images from four slices with 1-μm interval in depth were projected for each panel. Colocalized foci are indicated with arrows. Scale bars: 5 μm. (B) Wild-type or gga1Δgga2Δ double disruptant (GPY2385) cells were transformed with plasmids for expression of EGFP, EGFP-dGGA or yeast GGA2-13Myc. EGFP-dGGA expression was also induced with 0.5 mM CuSO4 for 8 hours (high exp.). The transformants were harvested and subjected to immunoblotting with anti-CPY antibody. (C) Quantification of the CPY processing. The ratio of the intensity of p2CPY to that of mCPY was plotted. The value indicate mean ± s.d. (D) CPY secretion assay. Cells growing in mid-log phase were spotted onto a nitrocellulose membrane placed on a growth plate. After incubation overnight, cells were washed out and the membrane was subjected to immunoblotting for CPY.

Similar articles

Cited by

References

    1. Bai H., Doray B., Kornfeld S. (2004). GGA1 interacts with the adaptor protein AP-1 through a WNSF sequence in its hinge region. J. Biol. Chem. 279, 17411-17417 - PubMed
    1. Black M. W., Pelham H. R. (2000). A selective transport route from Golgi to late endosomes that requires the yeast GGA proteins. J. Cell Biol. 151, 587-600 - PMC - PubMed
    1. Boehm M., Bonifacino J. S. (2001). Adaptins: the final recount. Mol. Biol. Cell 12, 2907-2920 - PMC - PubMed
    1. Bonifacino J. S. (2004). The GGA proteins: adaptors on the move. Nat. Rev. Mol. Cell. Biol. 5, 23-32 - PubMed
    1. Bonifacino J. S., Lippincott-Schwartz J. (2003). Coat proteins: shaping membrane transport. Nat. Rev. Mol. Cell. Biol. 4, 409-414 - PubMed

Publication types

MeSH terms

Substances