. 2010 Feb 1;123(Pt 3):413-23.
doi: 10.1242/jcs.058297. Epub 2010 Jan 12.

Cytoskeletal coherence requires myosin-IIA contractility

Affiliations

Cytoskeletal coherence requires myosin-IIA contractility

Yunfei Cai et al. J Cell Sci. .

Abstract

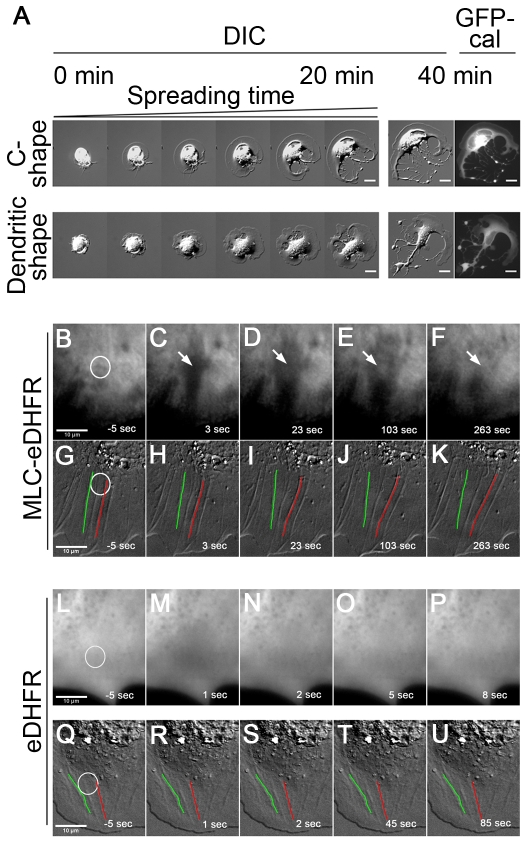
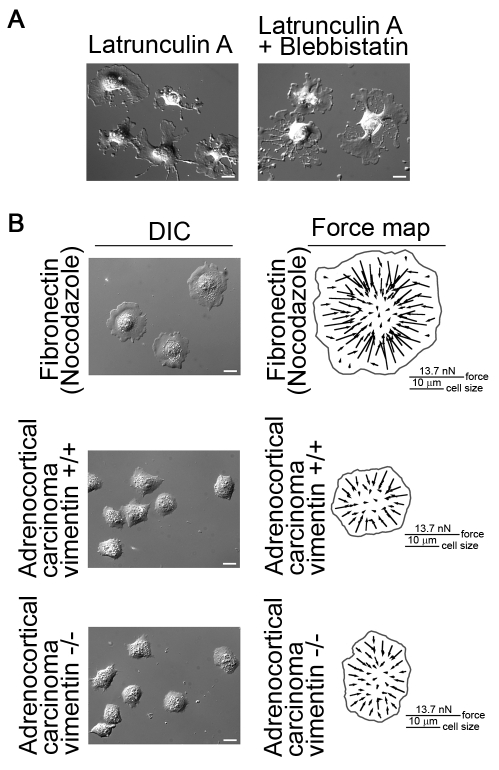
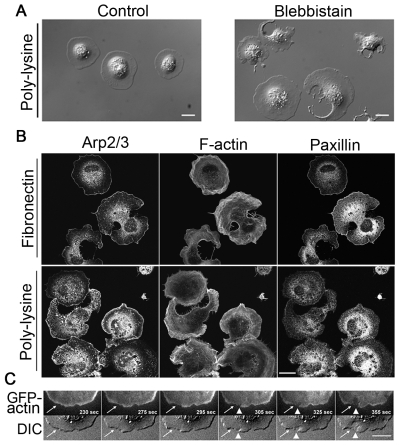
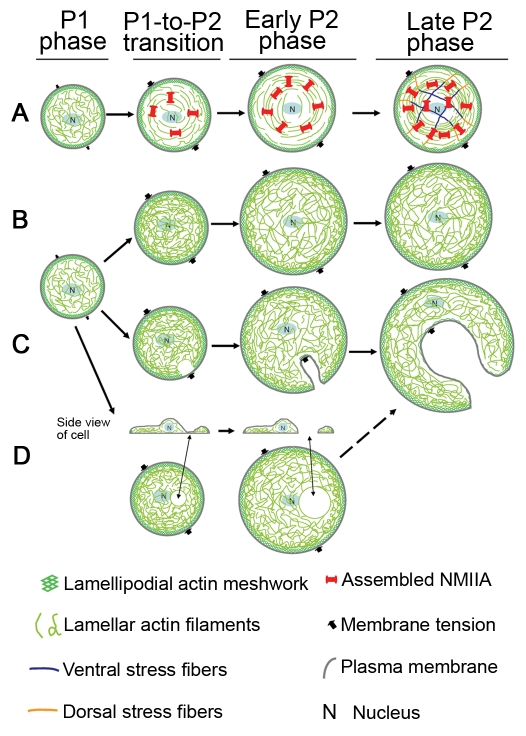
Maintaining a physical connection across cytoplasm is crucial for many biological processes such as matrix force generation, cell motility, cell shape and tissue development. However, in the absence of stress fibers, the coherent structure that transmits force across the cytoplasm is not understood. We find that nonmuscle myosin-II (NMII) contraction of cytoplasmic actin filaments establishes a coherent cytoskeletal network irrespective of the nature of adhesive contacts. When NMII activity is inhibited during cell spreading by Rho kinase inhibition, blebbistatin, caldesmon overexpression or NMIIA RNAi, the symmetric traction forces are lost and cell spreading persists, causing cytoplasm fragmentation by membrane tension that results in 'C' or dendritic shapes. Moreover, local inactivation of NMII by chromophore-assisted laser inactivation causes local loss of coherence. Actin filament polymerization is also required for cytoplasmic coherence, but microtubules and intermediate filaments are dispensable. Loss of cytoplasmic coherence is accompanied by loss of circumferential actin bundles. We suggest that NMIIA creates a coherent actin network through the formation of circumferential actin bundles that mechanically link elements of the peripheral actin cytoskeleton where much of the force is generated during spreading.


Figures

Fig. 1.
Fig. 1.
Pharmacological inhibition of NMII causes cytoplasm fragmentation. (A,B) Selected time-lapse sequential DIC images of control (A) and Y27632-treated (B) cells spreading on fibronectin-coated coverslips at early times. White arrows show cytoplasm rounding and shrinkage. Scar bar: 20 μm. (C) Summary of the morphologies of control and inhibitor-treated cells. Of control cells, 2±0.1% are ‘C’-shaped, 1±0.1% are dendritic, and 97±7.6% show no fragmentation. Of cells treated with 50 μM blebbistatin, 50±4.1% are ‘C’-shaped, 13±1.6% are dendritic, and 37±5.0% show no fragmentation. Of cells treated with 25 μM Y27632, 45±4.0% are ‘C’-shaped, 15±3.1% are dendritic, and 40±5.5% show no fragmentation. For each category, >200 cells were sampled from different experiments. Values are mean ± s.d. (D,E) Maps of inward-pulling forces applied onto fibronectin-coated pillars by control cells in P1 (D) and P2 (E) phases. Cells generate small forces in P1 phase (D) and generate large forces at cell periphery in P2 phase (E). (F) Numbers in colors are the net forces (vector sum) of the circled local forces in E. Arrows depict the magnitude and directions of the net forces. An important feature of force distribution is that large forces on one side of cell edge are symmetrically counterbalanced by large forces on the other side of cell edge in P2 phase, as indicated by paired circles with the same colors (E,F). (G,H) Maps of traction forces applied onto pillars by blebbistatin-treated cells at stages equivalent to P1 (G) and P2 (H) phases. Inhibition of NMII by blebbistatin leads to the generation of very small forces that are randomly orientated.
Fig. 2.
Fig. 2.
NMII-inhibited cells exhibit disorganized actin-NMII structure and unrestrained spreading. (A) Control and blebbistatin-treated cells were plated onto fibronectin-coated coverslips, fixed 20 minutes after plating (in P2), and stained for F-actin NMIIA or NMIIB. White arrowhead, nascent actin arc bundle; black arc-shaped box, circumferential actin bundles; black arrow, dorsal stress fiber; black arrowhead, ventral stress fiber. All single staining images are reconstructed from the entire confocal Z-stacks. Scale bar: 10 μm. Close-up images are overlay of confocal slices. (B) Comparison of the spread area between NMII-inhibited cells and control cells (yellow line). Each trace was obtained by plotting the average cell spread area (≥27 cells) as a function of cell-spreading time. The time interval between two sequential time points was 10 seconds. Blebbistatin-treated cells showing no fragmentation (blue line) had a spread area significantly larger than controls (P<0.05) 10 minute after initiation of spreading. The spread area within the first 10 minutes of spreading was similar. Cells showing fragmentation (pink line) spread to a similar area as controls (P<0.08) during the entire spreading process. The coordinates of a particular point on a given trace (i.e. unfragmented, fragmented or control) are defined by the average cell spread area at a particular spreading time point. When comparing the cell spread area, all the individual spread areas of the unfragmented or fragmented cells and of the control cells at a particular time point were sampled and subjected to Student's t-test analysis. The statistical analysis was performed for all the time points. (C) The results for Y27632-treated cells were similar to those for blebbistatin-treated cells.
Fig. 3.
Fig. 3.
Caldesmon overexpression and CALI of MLC reveals requirement of NMII in cytoplasm coherence. (A) Left panels: time-lapse sequential DIC images (within 20 minutes) of spreading cells with a high level of GFP-caldesmon overexpression, showing the dynamic formation of ‘C’ and dendritic shapes. Right panels: DIC and GFP epifluorescence images of the cells on the left panels at 40 minutes after spreading. Scale bars: 20 μm. (B-F) TIRF and (G-K) DIC images of the same cell expressing MLC-eDHFR labeled with fluorescein-conjugated TMP before (B,G) and after (C-F, H-K) laser irradiation. Negative times signify time before irradiation. White circles denote the irradiated region. A region devoid of fluorescence forms (arrow in C) after laser irradiation, which is enlarged with time. Meanwhile, fluorescence recovers (arrows in D-F). The decrease of cytoplasmic coherence is clearly displayed by the changes of shapes and positions of actin cables (used as markers) within or close to the irradiated region (G-K) in DIC images. For instance, the upper portion of the actin cable denoted by a green line is curved and clearly moves left, whereas the upper portion of the actin cable denoted by a red line is curved but moves right (H-K). The space between them becomes larger. (L-P) TIRF images of a cell. (Q-U) DIC images of another cell. Both cells expressed eDHFR that was labeled with fluorescein-conjugated TMP. Images L and Q are pre-irradiation images. Images M-P and R-U are post-irradiation images. eDHFR diffuses in the cell. Following laser irradiation (white circle), the eDHFR fluorescence recovers completely within 5 seconds (M-O). There is no indication of decrease of cytoplasmic coherence because the shapes and positions of marker actin cables (R-U) appear not to change.
Fig. 4.
Fig. 4.
Microtubules and intermediate filaments are not essential for cytoplasmic coherence whereas actin cytoskeleton is needed. (A) Depolymerization of F-actin alone or in combination with NMII inhibition induces cytoplasm fragmentation of fibroblasts on fibronectin substrate. (B) Fibroblasts treated with 1 μM nocodazole retain cytoplasmic coherence on fibronectin substrate and have the same force distribution patterns as control cells shown in Fig. 1, generating inward-pulling large forces at cell periphery and small forces in cell center. Human adrenocortical carcinoma cells (vimentin+/+) and human adrenocortical carcinoma vimentin knockout cells (vimentin−/−) also exhibit coherent cytoplasm and generate forces with similar patterns as control fibroblasts. Scale bars: 20 μm.
Fig. 5.
Fig. 5.
Unbalanced actin assembly, not the adhesion of cell to substrates, accounts for cell fragmentation when NMII is inhibited. (A) DIC images of fibroblasts spread on poly-lysine-coated glass for ~20 minutes. Control cells have coherent cytoplasm, whereas blebbistatin-treated cells show loss of cytoplasmic coherence similar to cells spread on fibronectin substrate. (B) Staining for Arp2/3, F-actin and paxillin in blebbistatin-treated fibroblasts spread on fibronectin and poly-lysine substrates. The distribution patterns of Arp2/3 and F-actin are similar in NMII-inhibited cells spread on both substrates. There is little or no accumulation of Arp2/3 along the edge of fragmented sites but there is clear accumulation of Arp2/3 along cell edge of other regions of fragmented cells and along the entire cell edge of unfragmented cells. The actin filaments are wavy in NMII-inhibited cells. Much less F-actin is seen at fragmented regions compared to unfragmented regions. Paxillin does not accumulate along the edge of fragmented regions but does along the edge of unfragmented regions when cells spread on fibronectin. By contrast, paxillin is more diffuse in NMII-inhibited cells spreading on poly-lysine. (C) Top panels are time-lapse images of TIRF GFP-actin and bottom panels are time-lapse DIC images of a cell spreading on fibronectin substrate. White arrows point to the region where the decrease in GFP-actin intensity precedes the initiation of cytoplasmic fragmentation. Arrowheads show the occurrence of cytoplasmic fragmentation. Scale bars: 20 μm.
Fig. 6.
Fig. 6.
Depletion of NMIIA, not NMIIB, causes loss of cytoskeletal coherence. Cells were transfected with siRNAs for ~96 hours and then spread for ~20-30 minutes on fibronectin-coated coverslips. After fixation, cells were tripled stained for NMIIA or NMIIB, F-actin and paxillin. Colors are pseudo-colors. (A) Control siRNA cells have prominent circumferential actin bundles, stress fibers and focal adhesions, which are not present in NMIIA siRNA cells. A large fraction of NMIIA siRNA cells exhibit ‘C’ shapes, dendritic shapes or have gaps in the actin cytoskeleton. Inset is DIC image of the cell with cytoskeleton gap. (B) siRNA NMIIB causes no changes in actin cytoskeleton and focal adhesion. Scale bars: 20 μm.
Fig. 7.
Fig. 7.
Model for development of cytoskeletal coherence and cytoplasmic fragmentation. The P0 phase of early cell spreading is a basal phase and not covered here. (A) There is little NMIIA assembly and contractility and consequent formation of contractile circumferential actin bundles in the fast-spreading P1 phase. As cells approach slow-spreading P2 phase, the assembly and activity of NMIIA increase dramatically. NMIIA contracts and crosslinks actin filaments into a network with tension that prevents cell cytoplasm from being broken by inward plasma membrane tension force. Cells also gain the ability to transmit traction forces from one side of the cell to the other side of the cell. As cell spreading continues through P2 phase, this coherent actin-NMIIA network is expanded. Stress fibers are formed at late P2 stages. (B) The coherent actomyosin-II network is not generated without NMIIA activity. Cells are left with a loose actin network that bears all the inward force exerted by membrane tension. Cell-edge regions with normal levels of actin polymerization are able to resist the pressure of the plasma membrane and do not collapse inward. (C) When peripheral actin polymerization is decreased even from normal variations in activity, the regions with the lowest level of actin polymerization are the weakest points and are most likely to collapse under membrane tension force. These are the initial membrane fragmentation site(s) during the formation of ‘C’- or dendritic-shaped cells. (D) If the regions in cell center are depleted of actin filaments due to lack of actin polymerization and/or a high level of actin depolymerization, holes in the center of the actin network develop. The dorsal and ventral plasma membranes then might come close and fuse, leading to the formation of complete holes. These holes might expand under membrane tension force and eventually also result in the formation of ‘C’ or dendritic shapes.

References

    1. Alexandrova A. Y., Dugina V. B., Ivanova O. Y., Kaverina I. N., Vasiliev J. M. (1998). Scatter factor induces segregation of multinuclear cells into several discrete motile domains. Cell Motil. Cytoskeleton 39, 147-158 - PubMed
    1. Balaban N. Q., Schwarz U. S., Riveline D., Goichberg P., Tzur G., Sabanay I., Mahalu D., Safran S., Bershadsky A., Addadi L., et al. (2001). Force and focal adhesion assembly: a close relationship studied using elastic micropatterned substrates. Nat. Cell Biol. 3, 466-472 - PubMed
    1. Ballestrem C., Wehrle-Haller B., Hinz B., Imhof B. A. (2000). Actin-dependent lamellipodia formation and microtubule-dependent tail retraction control-directed cell migration. Mol. Biol. Cell 11, 2999-3012 - PMC - PubMed
    1. Bao J., Ma X., Liu C., Adelstein R. S. (2007). Replacement of nonmuscle myosin II-B with II-A rescues brain but not cardiac defects in mice. J. Biol. Chem. 282, 22102-22111 - PubMed
    1. Bar-Ziv R., Tlusty T., Moses E., Safran S. A., Bershadsky A. (1999). Pearling in cells: a clue to understanding cell shape. Proc. Natl. Acad. Sci. USA 96, 10140-10145 - PMC - PubMed

Publication types

MeSH terms