. 2010 Feb 1;123(Pt 3):431-40.
doi: 10.1242/jcs.053793. Epub 2010 Jan 12.

Myosin light chain kinase mediates transcellular intravasation of breast cancer cells through the underlying endothelial cells: a three-dimensional FRET study

Affiliations

Myosin light chain kinase mediates transcellular intravasation of breast cancer cells through the underlying endothelial cells: a three-dimensional FRET study

Satya Khuon et al. J Cell Sci. .

Abstract

The transient and localized signaling events between invasive breast cancer cells and the underlying endothelial cells have remained poorly characterized. We report a novel approach integrating vascular engineering with three-dimensional time-lapse fluorescence resonance energy transfer (FRET) imaging to dissect how endothelial myosin light chain kinase (MLCK) is modulated during tumor intravasation. We show that tumor transendothelial migration occurs via both paracellular (i.e. through cell-cell junctions) and transcellular (i.e. through individual endothelial cells) routes. Endothelial MLCK is activated at the invasion site, leading to regional diphosphorylation of myosin-II regulatory light chain (RLC) and myosin contraction. Blocking endothelial RLC diphosphorylation blunts tumor transcellular, but not paracellular, invasion. Our results implicate an important role for endothelial myosin-II function in tumor intravasation.


Figures

Fig. 1.
Fig. 1.
Polarized endothelial cells maintain their mechano-sensing capability and form an interconnected and lumenized 3D vascular network in collagen gel matrix. (A) Confocal micrographs of endothelial cells forming an extensive vascular network 2 days after 3D gel assembly. (B) 3D reconstruction of the vascular network, tilted at an angle to highlight the multilayered nascent vascular tubes. (C) Absence of vascular network in the 3D gel with compromised isometric tension development. (D) Confocal optical section through a nascent vessel 24 hours after gel assembly. Note the number of vacuoles accumulating in the endothelial cell (red arrows). The vacuoles are of various sizes and separated by septum in the cytoplasm. (E) Confocal image of a vessel 2 days after gel assembly shows vacuoles gradually coalesced to form continuous lumen (red arrows). (F) At 3 days after gel assembly, endothelial cells establish a mature 3D vascular network with well-formed lumen and also show extensive sprouting (white arrows). The orthogonal view of the region indicated by the red dotted line shows the formation of lumen, as indicated by the red arrows. This network was constructed using endothelial cells expressing the MLCK FRET sensor, shown here in monochrome green. (G,H) Electron micrographs show the formation of lumen devoid of extracellular matrix components (red arrows). Scale bars: 1 μm. (I,J) Confocal micrographs showing the lateral and cross-sectional view of a single lumen extending through multiple cells in the 3D vascular network. Cell-cell border is marked by VE-cadherin immunostaining. Arrow in each direction represents100 μm. (K,L) Confocal 3D reconstructions showing endothelial cell (green) and α4 laminin (red) deposited at the periphery of the vascular system. The reconstructed image was digitally dissected to show the lumen and the deposition of α4-laminin. (L) Enlarged cross-sectional view of the engineered vessel, showing that the endothelial cells established well-demarcated apical-basal polarity in correct orientation.
Fig. 2.
Fig. 2.
Dynamic 3D interaction of MDA-MB231 breast cancer cells with the vascular network in vitro. (A) Electron micrograph demonstrating the deformation of endothelial cytoplasmic by an MDA-MB231 cell. Note that the tumor cell entered an area next to the endothelial cell nucleus that is devoid of endothelial cell-cell junction. Scale bar: 1 μm. (B) 3D reconstruction of confocal microscopy showing the engulfment of an MDA-MB231 cell (red) by an endothelial cell (green). (C-E) Time-lapsed confocal microscopy showing the extension of a finger-like protrusion (white arrows) from the endothelial cell (green) towards the MDA-MB231 cell. (F-I) Time-lapsed confocal microscopy shows that prolonged interaction with the tumor cell (red) usually triggers active endothelial membrane protrusion and ruffling (arrows). In this case, the endothelial cell protrusive spikes coalesced into a cup-like, actively ruffling structure (see supplementary material Movie 1). The indicated time points are in minutes:seconds. (J) Confocal micrographs showing the maximal projection and orthogonal view of the endothelial myosin network in 2D monolayer forming an invasion ring-like structure, encapsulating the invading tumor cell. Scale bar: 5 μm. (K) 3D reconstruction of the same invasion ring (180 degree rotation of view from that presented in J) showing a perfectly formed pore through which the tumor cell could gain access to the other side of the endothelium. The cancer cell (red channel) is digitally removed to show the invasion pore. (L) Single confocal optical plane across an endothelial cell expressing GFP-RLC within a 3D vessel, indicating that the invasion pores can also form in a 3D vasculature network, in this case surrounding an mCherry-expressing MDA-MB231.
Fig. 3.
Fig. 3.
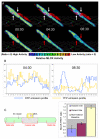
Breast cancer cells invade the vasculature and induce endothelial MLCK activation. Endothelial cells expressing the MLCK sensor were used to generate a vascular system capable of MLCK signaling read-out during tumor invasion. (A) Portion of the blood vessel being simultaneously invaded by two MDA-MB231 breast cancer cells (red cells, white arrows). Relative MLCK activity is displayed using ratio imaging as previously described (Chew et al., 2002). Loss of FRET during MLCK activation turns the ratio color ‘bluer’, as indicated by the ratio bar. The bottom panels show the identical 3D FRET ratiometric images, but with the red channel, which represents the cancer cells, digitally removed to highlight the FRET changes in the endothelial cell underneath. (B) Analysis of the CFP and YFP emission spectra along the indicated dotted line. The invasion of the tumor cells into the endothelium triggered a highly localized drop in YFP emission with a concomitant increase in CFP emission intensity, indicating that MLCK was activated. Indicated time points are in minutes:seconds (n=12) (see supplementary material Movie 2). (C) Left: Pre-defined regions for quantitative analysis of invasion-mediated MLCK activation. The ‘invasion site’ is defined as the region centered on the tumor entry site, spanning the length of three tumor cells. A ‘distal site’ is defined as the region of the same vessel tube at least two cell-lengths away from the invading cancer cell. Right: 21 invasion events were analyzed and the average FRET ratio changes were plotted. Lower FRET ratio corresponds to higher MLCK activity. Vessels that are not in contact with tumor cells serve as FRET ratio baseline. Error bars represent s.e.m.
Fig. 4.
Fig. 4.
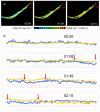
Cameleon biosensor indicates an increase in intracellular Ca2+ in endothelial cells. (A) Time-lapse 3D FRET ratiometric confocal micrographs of Cameleon sensor in an endothelial cell. The interaction with a MDA-MB231 cell (red) induced a Ca2+ wave that was rapidly propagated along the entire length of the endothelial cell. The Ca2+ wave is ~30% above baseline. (n=3 out of 3) All indicated time points are in minutes:seconds. (B) Real-time raw intensity profiles of CFP and YFP from the Cameleon sensor along the white dotted line over the endothelial cell in Fig. 4A. Red arrows bracket the regions with increase FRET activity (high Ca2+ concentration). Note the propagation of the Ca2+ front from the initial tumor interaction site.
Fig. 5.
Fig. 5.
Enrichment of diphosphorylated RLC at transcellular invasion site in endothelial cells. (A) MDA-MB231 cell transiently expressing untagged mCherry fluorescent protein. (B) Overlay of endothelial myosin network (green) and an MDA-MB231 cell undergoing transcellular migration. Note the myosin ring that surrounds the tumor cell. Scale bar: 10 μm. (C) Endothelial myosin network as displayed by GFP-RLC. (D) Immunofluorescence with antibody specific for the diphosphorylated (phosphorylated at Thr18 and Ser19) form of RLC (RLC-pp). (E) The distribution of diphosphorylated RLC was assessed by determining the ratio of phosphorylated RLC (from D) to total myosin-II (from C), and displayed according to the ratio bar. Myosin with very high phosphorylated RLC is indicated in red (white arrow). 26 out of 27 transcellular invasion events showed marked increase in RLC diphosphorylation around the invasion ring. (F-J) Comparable analyses were performed on MDA-MB231 cells undergoing paracellular invasion. A representative invasion event is presented here. Scale bar: 20 μm. None of the 31 paracellular invasion events analyzed displayed myosin ring formation. A representative paracellular invasion event is shown. These assays were performed on a 2D surface to allow for accurate ratiometric imaging analysis.
Fig. 6.
Fig. 6.
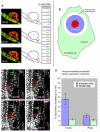
Elevation of endothelial myosin-II contractile activity at transcellular invasion site. (A) Confocal micrograph of MDA-MB231 (red) transcellular invasion into an endothelial cell expressing GFP-RLC. (middle panels) Outline of the cells and five prominent endothelial stress fibers are presented. (right panels) Myosin-II contraction is expressed as a percentage stress-fiber shortening as compared with the initial lengths. The color of the % matches the color of the stress fiber outline (four of four invasion events showed regional stress-fiber shortening. Representative cell is shown). Indicated time points are in minutes:seconds. (B) To obtain a quantitative analysis of local increased rate of myosin contraction, two distinct regions were pre-defined. The ‘invasion site’ (blue) is defined as the region centered on the tumor entry site, spanning the diameter of three tumor cells. A ‘distal site’ (green) is defined as the region of the same vessel tube at least two cell-diameters away from the invading cancer cell. To eliminate potential overlap, we avoided the region immediately surrounding the invasion site (white). (C) High resolution time-lapse 2D spinning disk confocal micrographs showing how sarcomeric distance as indicated by GFP-RLC can be measured. Time is in minutes:seconds. Scale bar: 2 μm. Red and green arrows denotes two separate sets of sarcomeres being measured. The actual invasion ring usually contains myosin sarcomeres too compact to be included for accurate measurement. (D) Rate of myosin contraction as determined by the shortening of inter-sarcomeric distance (% shortening in 5 minutes) during transcellular and paracellular invasion. Results from eight transcellular (Trans) and eight paracellular (Para) events are plotted (total number of sarcomeres measured was 126). Error bars represent s.e.m.
Fig. 7.
Fig. 7.
MDA-MB231 transcellular invasion is dependent on phosphorylation of endothelial myosin-II RLC. (A) Orthogonal view of confocal micrograph showing example of a paracellular invasion event; MDA-MB 231 cell (red), VE-cadherin (light blue), GFP-RLC (green). (B) Confocal micrograph showing example of how paracellular (red arrow) and transcellular (white arrow) invasions are scored. Grey horizontal line indicates the cross-sectional cut of which the orthogonal view is presented in C. (C) Magnified orthogonal view showing the location of VE-cadherin along the Z-axis, which is found near the bottom slice of the Z-stacks (<900nm from the coverslip). Arrows show that at this Z location, the breast cancer cell would have penetrated the endothelial layer. Only images from this Z-section were used for image analysis. (D) Bar graphs and table showing the actual cell count and the percentage of MDA-MB231 invasion via paracellular and transcellular routes when challenged by endothelial cells expressing wild-type or mutant RLC. Endothelial cells mock-transfected with empty pEGFP-C1 vector serve as control.
Fig. 8.
Fig. 8.
Postulated role of myosin-II contraction in tumor intravasation. Schematic illustration of how myosin-II could contribute to the paracellular and transcellular routes of tumor intravasation. Top: in the paracellular route, perturbation of endothelial junctional complexes allows tumor cells to undergo paracellular intravasation. Myosin-II contraction will probably increase gap size and facilitate tumor cell transmigration. However, the disruption of endothelial cell-cell junctions might be sufficient to allow the passage of highly invasive tumors. Bottom: in the transcellular invasion model, the endothelial intermediate filaments (green lines) might form a highly interconnected cytoskeletal cage around the invading tumor cell, in close resemblance to leukocyte trafficking (Nieminen et al., 2006). The highly crosslinked cytoskeletal network provides a molecular handle with which the active endothelial myosin-II contraction can facilitate the entrance of a tumor cell into the endothelial lumen.

Similar articles

Cited by

References

    1. Amano M., Ito M., Kimura K., Fukata Y., Chihara K., Nakano T., Matsuura Y., Kaibuchi K. (1996). Phosphorylation and activation of myosin by Rho-associated kinase (Rho-kinase). J. Biol. Chem. 271, 2026-2029 - PubMed
    1. Amano M., Chihara K., Kimura K., Fukata Y., Nakamura N., Matsuura Y., Kaibuchi K. (1997). Formation of actin stress fibers and focal adhesions enhanced by Rho-kinase. Science 275, 1308-1311 - PubMed
    1. Bell S. E., Mavila A., Salazar R., Bayless K. J., Kanagala S., Maxwell S. A., Davis G. E. (2001). Differential gene expression during capillary morphogenesis in 3D collagen matrices: regulated expression of genes involved in basement membrane matrix assembly, cell cycle progression, cellular differentiation and G-protein signaling. J. Cell Sci. 114, 2755-2773 - PubMed
    1. Bresnick A. R. (1999). Molecular mechanisms of nonmuscle myosin-II regulation. Curr. Opin. Cell Biol. 11, 26-33 - PubMed
    1. Carman C. V., Springer T. A. (2004). A transmigratory cup in leukocyte diapedesis both through individual vascular endothelial cells and between them. J. Cell Biol. 167, 377-388 - PMC - PubMed

Publication types

Substances