

Fine-mapping a locus for glucose tolerance using heterogeneous stock rats
- PMID: 20068026
- PMCID: PMC2841497
- DOI: 10.1152/physiolgenomics.00178.2009
Fine-mapping a locus for glucose tolerance using heterogeneous stock rats
Abstract
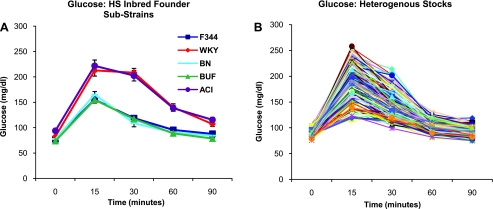
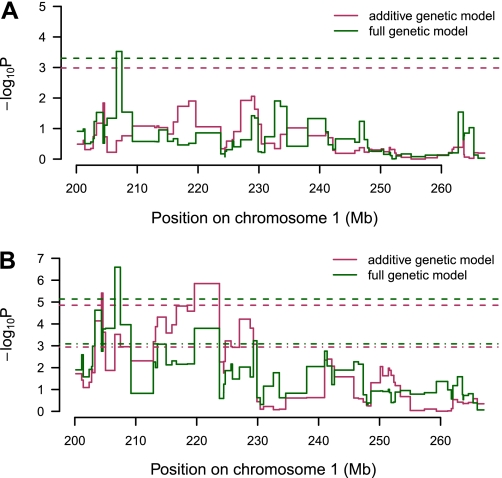
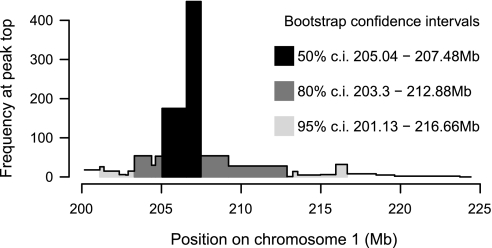
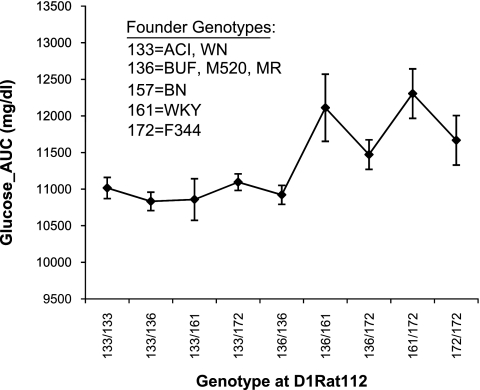
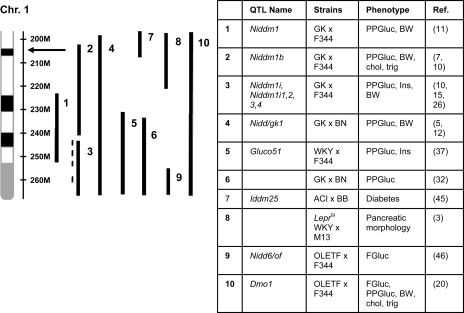
Heterogeneous stock (HS) animals provide the ability to map quantitative trait loci at high resolution [<5 Megabase (Mb)] in a relatively short time period. In the current study, we hypothesized that the HS rat colony would be useful for fine-mapping a region on rat chromosome 1 that has previously been implicated in glucose regulation. We administered a glucose tolerance test to 515 HS rats and genotyped these animals with 69 microsatellite markers, spaced an average distance of <1 Mb apart, on a 67 Mb region of rat chromosome 1. Using regression modeling of inferred haplotypes based on a hidden Markov model reconstruction and mixed model analysis in which we accounted for the complex family structure of the HS, we identified one sharp peak within this region. Using positional bootstrapping, we determined the most likely location of this locus is from 205.04 to 207.48 Mb. This work demonstrates the utility of HS rats for fine-mapping complex traits and emphasizes the importance of taking into account family structure when using highly recombinant populations.
Figures
Similar articles
-
QTL mapping in outbred populations: successes and challenges.Physiol Genomics. 2014 Feb 1;46(3):81-90. doi: 10.1152/physiolgenomics.00127.2013. Epub 2013 Dec 10. Physiol Genomics. 2014. PMID: 24326347 Free PMC article. Review.
-
Fine-mapping diabetes-related traits, including insulin resistance, in heterogeneous stock rats.Physiol Genomics. 2012 Nov 1;44(21):1013-26. doi: 10.1152/physiolgenomics.00040.2012. Epub 2012 Sep 4. Physiol Genomics. 2012. PMID: 22947656 Free PMC article.
-
Fine mapping of bone structure and strength QTLs in heterogeneous stock rat.Bone. 2015 Dec;81:417-426. doi: 10.1016/j.bone.2015.08.013. Epub 2015 Aug 19. Bone. 2015. PMID: 26297441 Free PMC article.
-
Heterogeneous Stock Populations for Analysis of Complex Traits.Methods Mol Biol. 2017;1488:31-44. doi: 10.1007/978-1-4939-6427-7_2. Methods Mol Biol. 2017. PMID: 27933519 Free PMC article.
-
High-resolution quantitative trait locus analysis reveals multiple diabetes susceptibility loci mapped to intervals<800 kb in the species-conserved Niddm1i of the GK rat.Genetics. 2006 Nov;174(3):1565-72. doi: 10.1534/genetics.106.062208. Epub 2006 Sep 1. Genetics. 2006. PMID: 16951059 Free PMC article.
Cited by
-
Extended regions of suspected mis-assembly in the rat reference genome.Sci Data. 2019 Apr 23;6(1):39. doi: 10.1038/s41597-019-0041-6. Sci Data. 2019. PMID: 31015470 Free PMC article.
-
QTL mapping in outbred populations: successes and challenges.Physiol Genomics. 2014 Feb 1;46(3):81-90. doi: 10.1152/physiolgenomics.00127.2013. Epub 2013 Dec 10. Physiol Genomics. 2014. PMID: 24326347 Free PMC article. Review.
-
The Wistar Kyoto Rat: A Model of Depression Traits.Curr Neuropharmacol. 2023;21(9):1884-1905. doi: 10.2174/1570159X21666221129120902. Curr Neuropharmacol. 2023. PMID: 36453495 Free PMC article.
-
Multi-Omic Approaches to Identify Genetic Factors in Metabolic Syndrome.Compr Physiol. 2021 Dec 29;12(1):3045-3084. doi: 10.1002/cphy.c210010. Compr Physiol. 2021. PMID: 34964118 Free PMC article.
-
Heterogeneous stock rat: a unique animal model for mapping genes influencing bone fragility.Bone. 2011 May 1;48(5):1169-77. doi: 10.1016/j.bone.2011.02.009. Epub 2011 Feb 18. Bone. 2011. PMID: 21334473 Free PMC article.
References
-
- Caballero A, Toro MA. Interrelations between effective population size and other pedigree tools for the management of conserved populations. Genet Res 75: 331–343, 2000 - PubMed
-
- Cho YM, Park KS, Lee HK. Genetic factors related to mitochondrial function and risk of diabetes mellitus. Diabetes Res Clin Pract 77, Suppl 1: S172–S177, 2007 - PubMed
-
- Chung WK, Zheng M, Chua M, Kershaw E, Power-Kehoe L, Tsuji M, Wu-Peng XS, Williams J, Chua SC, Jr, Leibel RL. Genetic modifiers of Leprfa associated with variability in insulin production and susceptibility to NIDDM. Genomics 41: 332–344, 1997 - PubMed
-
- Collins SC, Wallis RH, Wilder SP, Wallace KJ, Argoud K, Kaisaki PJ, Bihoreau MT, Gauguier D. Mapping diabetes QTL in an intercross derived from a congenic strain of the Brown Norway and Goto-Kakizaki rats. Mamm Genome 17: 538–547, 2006 - PubMed
Publication types
MeSH terms
Substances
Grants and funding
LinkOut - more resources
Full Text Sources
Miscellaneous