. 2010 Mar 12;285(11):8171-84.
doi: 10.1074/jbc.M109.031575. Epub 2010 Jan 12.

Nuclear erythroid factor 2-mediated proteasome activation delays senescence in human fibroblasts

Affiliations

Nuclear erythroid factor 2-mediated proteasome activation delays senescence in human fibroblasts

Suzanne Kapeta et al. J Biol Chem. .

Abstract

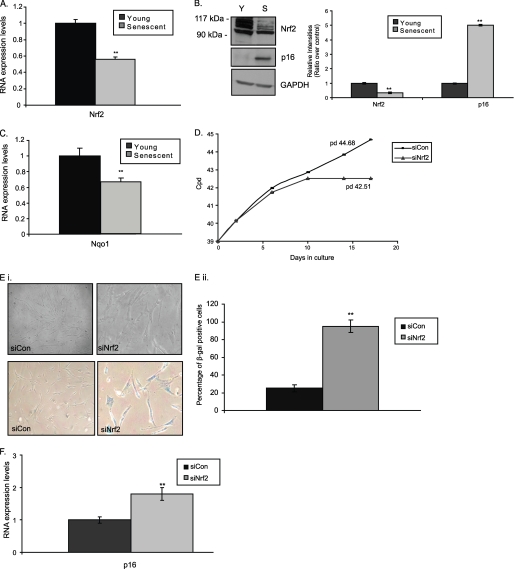
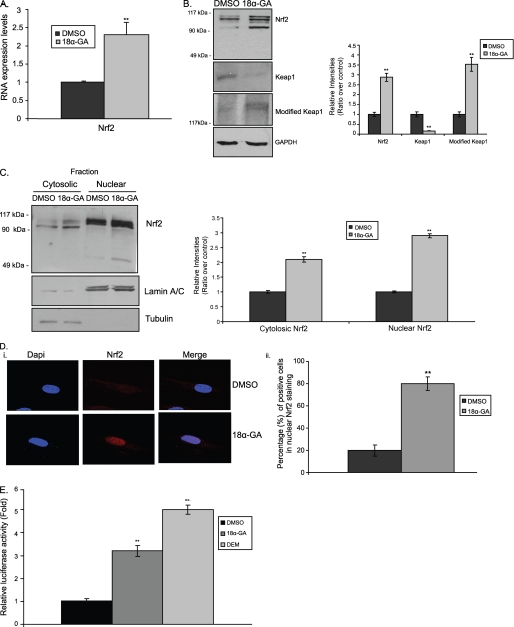
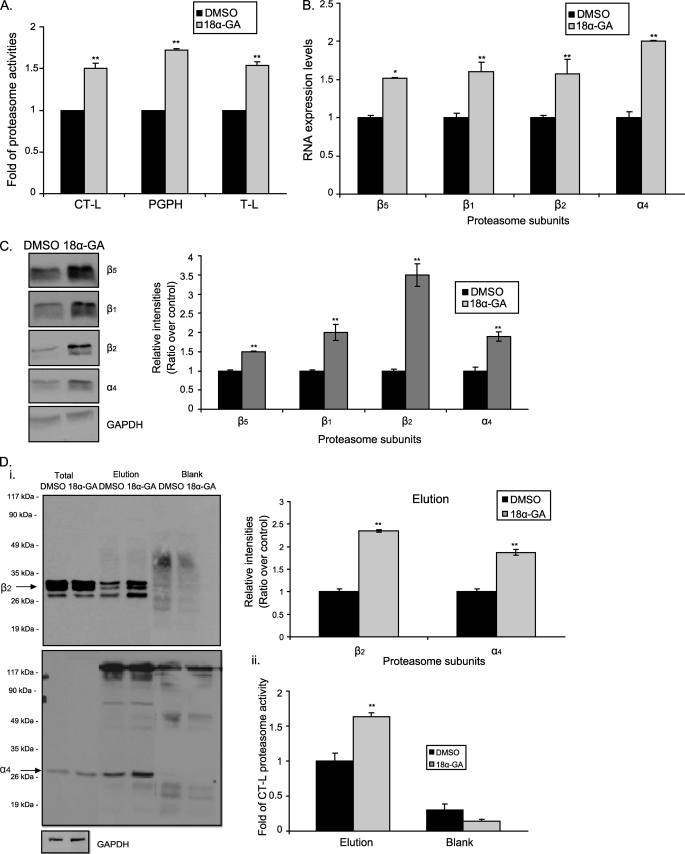
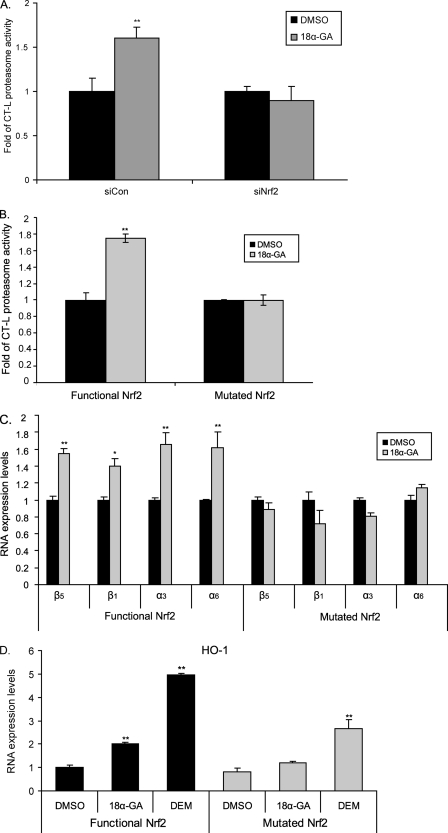
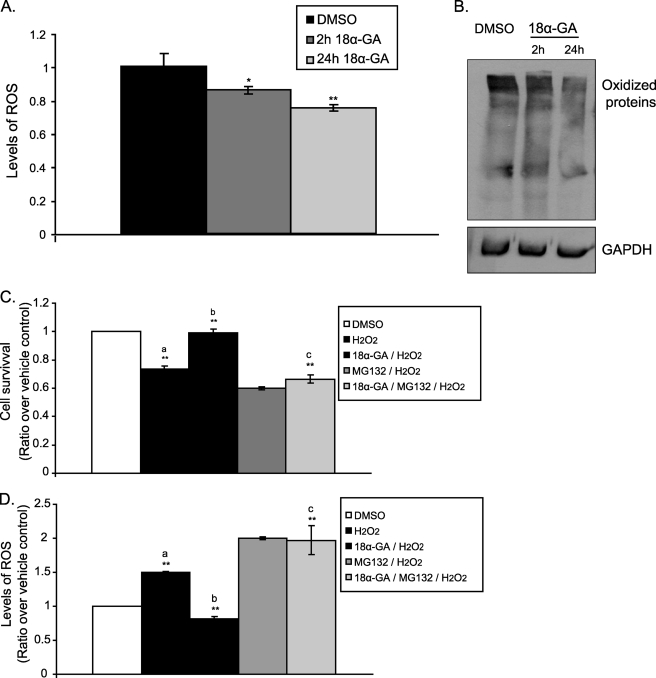
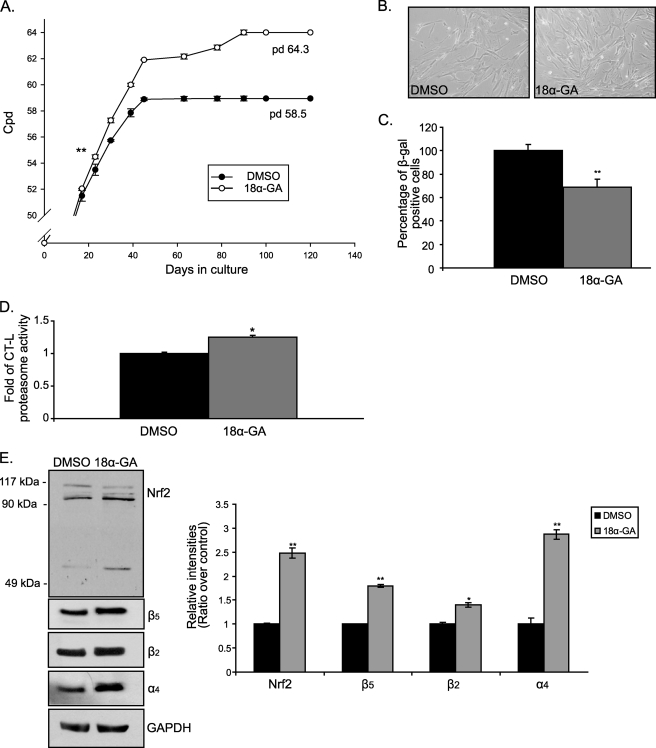
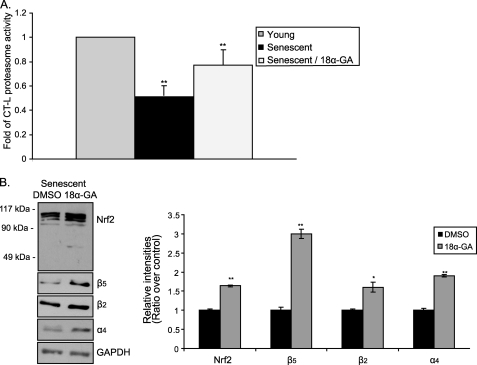
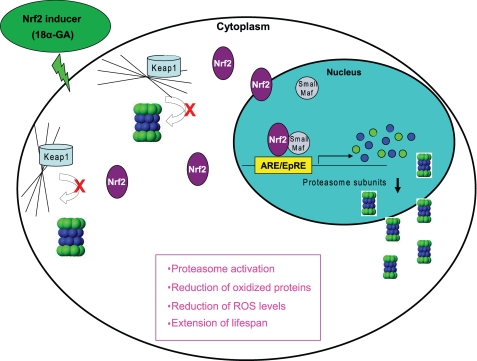
Replicative senescence in human fibroblasts is accompanied with alterations of various biological processes, including the impaired function of the proteasome. The proteasome is responsible for the removal of both normal and damaged proteins. Due to its latter function, proteasome is also considered a representative secondary antioxidant cellular mechanism. Nrf2 is a basic transcription factor responsible for the regulation of the cellular antioxidant response that has also been shown to regulate several proteasome subunits in mice. We have established in this study the proteasome-related function of Nrf2 in human fibroblasts undergoing replicative senescence. We demonstrate that Nrf2 has a declined function in senescence, whereas its silencing leads to premature senescence. However, upon its activation by a novel Nrf2 inducer, elevated levels of proteasome activity and content are recorded only in cell lines possessing a functional Nrf2. Moreover, treatment by the Nrf2 inducer results in the enhanced survival of cells following oxidative stress, whereas continuous treatment leads to lifespan extension of human fibroblasts. Importantly the Nrf2-proteasome axis is functional in terminally senescent cultures as these cells retain their responsiveness to the Nrf2 stimuli. In conclusion, these findings open up new directions for future manipulation of the senescence phenotype.


Figures

FIGURE 1.
FIGURE 1.
Lower expression levels of transcription factor Nrf2 during replicative senescence. Quantification of RNA expression levels of Nrf2 (A) and NADPH quinone oxidoreductase (Nqo1) (C) in young and senescent HFL-1 fibroblasts following real time PCR analysis. RNA expression levels in young fibroblasts were arbitrary set to 1. B, immunoblot analysis and the relative quantification of Nrf2 in young (Y) and senescent (S) HFL-1 fibroblasts. Lower exposure of the Nrf2 immunoblot to show the specific Nrf2 bands is included in supplemental Fig. S1C. p16 expression was used as a marker of senescence. GAPDH levels were used as loading control. Molecular mass markers are indicated on the left side of the Nrf2 blot. D, number of cpds of HFL-1 cells transfected with Nrf2 siRNA (siNrf2) or scrambled siRNA (siCon) constantly every 2 days for up to 17 days. Numbers on the graph show the population doublings (pd) measured on the 17th day of treatment. E, panel i, representative photographs of cells (upper panel) and cells following β-galactosidase activity staining (lower panel); panel ii, percentage of β-galactosidase positive cells; and F, quantification of p16 RNA expression levels in HFL-1 cells transfected with Nrf2 siRNA (siNrf2) or scrambled siRNA (siCon) constantly every 2 days for up to 17 days. RNA expression levels in HFL-1 cells transfected with scrambled siRNA were arbitrary set to 1. All values are reported as mean of three independent experiments ± S.D. Statistical significance at p < 0.01 is denoted by double asterisks.
FIGURE 2.
FIGURE 2.
Activation of Nrf2 by 18α-GA. A, quantification of RNA expression levels of Nrf2 in HFL-1 cells treated with 2 μg/ml of 18α-GA or DMSO for 2 h. Nrf2 RNA expression levels in DMSO-treated cells were arbitrary set to 1. B, immunoblot analysis of Nrf2, Keap1, and modified Keap1 and the relative quantification in HFL-1 cells treated with 2 μg/ml of 18α-GA or DMSO for 2 h. GAPDH levels were used as loading control. C, cell fractionation and relative quantification of Nrf2 in HFL-1 cells treated with 2 μg/ml of 18α-GA or DMSO for 2 h. Lower exposure of the Nrf2 immunoblot to show the specific Nrf2 bands is included in supplemental Fig. 1D, iii. Tubulin and lamin A/C were used as markers of cytosolic and nuclear fractions, respectively. D, panel i, Nrf2 localization analyzed by confocal microscopy; and panel ii, percentage of cells with nuclear Nrf2 accumulation, in HFL-1 cells treated with 2 μg/ml of 18α-GA or DMSO for 2 h. 4′,6-Diamidino-2-phenylindole (DAPI) was used as a marker for nucleus visualization. E, luciferase activity in HFL-1 cells transfected with the pTi-ARE-Luc construct and treated with 2 μg/ml of 18α-GA or DMSO for 2 h. Treatment with DEM for 24 h was used as positive control. Luciferase activity in DMSO-treated cells was arbitrary set to 1. Molecular mass markers in B and C are indicated on the left side of the Nrf2 and modified Keap1 blots. All values are reported as mean of three independent experiments ± S.D. Statistical significance at p < 0.01 is denoted by double asterisks.
FIGURE 3.
FIGURE 3.
Proteasome activation by 18α-GA. A, manifold of CT-L, PGPH, and trypsin-like proteasome activities in young HFL-1 cells treated with 2 μg/ml of 18α-GA or DMSO for 2 h. Use of proteasome inhibitor (MG132) in control reactions ensured the specificity of the enzymatic reaction. B, real time PCR; and C, immunoblot analysis and the relative quantification of proteasome subunits (β5, β1, β2, and α4) in HFL-1 cells treated with 2 μg/ml of 18α-GA or DMSO for 2 h. RNA expression levels of each gene in DMSO-treated cells were arbitrary set to 1. GAPDH levels were used as loading control. D, panel i, immunoblot analysis with the relative quantification of representative proteasome subunits (β2, α4) in total extracts and the relative elutions following proteasome immunoprecipitation in HFL-1 fibroblasts treated with 2 μg/ml of 18α-GA or DMSO for 2 h. Molecular mass markers are indicated on the left side of the blots. Panel ii, levels of CT-L proteasome activity in immunoprecipitated proteasomes of HFL-1 fibroblasts treated with 2 μg/ml of 18α-GA or DMSO for 2 h. Activity or protein levels in DMSO-treated cells were arbitrary set to 1. Blank samples represent the control immunoprecipitation samples. Immunoblot analysis of GAPDH (lower panel) in total extracts shows the equal starting protein quantity before immunoprecipitation. Lower exposure of the β2 immunoblot in total extracts is included in supplemental Fig. S1E. All values are reported as mean of three independent experiments ± S.D. Statistical significance at p < 0.05 or p < 0.01 are denoted by single or double asterisks, respectively.
FIGURE 4.
FIGURE 4.
Nrf2-mediated proteasome activation by 18α-GA. A, levels of CT-L proteasome activity in HFL-1 cells transfected with 75 nm Nrf2 siRNA (siNrf2) or scrambled siRNA (siCon) for 48 h and then treated with 2 μg/ml 18α-GA or DMSO for 2 h. B, levels of CT-L proteasome activity and C and D, RNA expression levels of (C) proteasome subunits (β5, β1, α3, α6), and (D) heme oxygenase-1 (HO-1) gene revealed by real time PCR analysis, in the presence or absence of functional Nrf2 in E8.T4 cells treated with 2 μg/ml 18α-GA or DMSO (and DEM in D) for 16 h. Mean value of activities and RNA expression levels in DMSO-treated cells were set to 1. All values are reported as mean of three independent experiments ± S.D. Statistical significance at p < 0.05 or p < 0.01 denoted by single or double asterisks, respectively.
FIGURE 5.
FIGURE 5.
Cytoprotective effect of 18α-GA against oxidative stress. ROS levels (A) and immunoblot analysis (B) of oxidized proteins in HFL-1 cells treated with 2 μg/ml 18α-GA or DMSO for 2 and 24 h. Levels of ROS in DMSO-treated cells were set to 1. GAPDH levels were used as loading control. Cell survival (C) and ROS levels (D) following H2O2 treatment in the presence of 18α-GA with or without proteasome inhibition. HFL-1 cells were preincubated with 2 μg/ml 18α-GA or DMSO for 24 h, then challenged with 300 μm H2O2 for 20 h in the presence or not of 20 μm MG132, and the cell number and ROS levels were determined. Number of cells and levels of ROS in DMSO-treated cells were set to 1. a, p < 0.01 as compared with DMSO-treated cells; b, p < 0.01 as compared with H2O2-treated cells; c, p < 0.01 as compared with 18α-GA/H2O2-treated cells. All values are reported as mean of three independent experiments ± S.D. Statistical significance at p < 0.05 or p < 0.01 are denoted by single or double asterisks, respectively.
FIGURE 6.
FIGURE 6.
18α-GA treatment extends lifespan in human fibroblasts. A, number of cpds of HFL-1 cells treated with 2 μg/ml of 18α-GA or DMSO throughout their lifespan. Numbers on the graph show the population doublings (pd) performed at the end of treatment. Asterisks show the first statistically significant difference between the two different groups (on the 23rd day of treatment). This significance is maintained during all following time points. B, representative photographs of HFL-1 cells treated with 2 μg/ml of 18α-GA or DMSO throughout their lifespan at 120 days (terminally senescent cultures). C, percentage of β-galactosidase positive HFL-1 cells treated with 2 μg/ml of 18α-GA or DMSO throughout their lifespan at 120 days. D, levels of CT-L proteasome activity in senescent fibroblasts treated with 18α-GA or DMSO throughout their 120-day lifespan. Recorded levels in DMSO-treated cells were arbitrary set to 1. E, immunoblot analysis and the relative quantification of Nrf2 and proteasome subunits (β5, β2, α4) in HFL-1 cells treated with 2 μg/ml of 18α-GA or DMSO throughout their lifespan at 50 days (pre-senescent cultures). GAPDH levels were used as loading control. Molecular mass markers are indicated on the left side of the Nrf2 blot. All values are reported as mean of three independent experiments ± S.D. Statistical significance at p < 0.05 or p < 0.01 are denoted by single or double asterisks, respectively.
FIGURE 7.
FIGURE 7.
18α-GA treatment induces proteasome activation in terminally senescent human fibroblasts. A, levels of CT-L proteasome activity; and B, immunoblot analysis and the relative quantification of Nrf2 and proteasome subunits (β5, β2, α4) in senescent HFL-1 cells treated with 2 μg/ml of 18α-GA or DMSO for 2 h. Mean value of CT-L proteasome activity in young cells was arbitrary set to 1. GAPDH levels were used as loading control. Molecular mass markers are indicated on the left side of the Nrf2 blot. All values are reported as mean of three independent experiments ± S.D. Statistical significance at p < 0.05 or p < 0.01 are denoted by single or double asterisks, respectively.
FIGURE 8.
FIGURE 8.
Overview of the Nrf2-mediated activation of the proteasome by 18α-GA. Model summarizing the effects of 18α-GA in human fibroblasts. 18α-GA induces Nrf2 dissociation from Keap1 as well as its de novo expression. Nrf2 translocates to the nucleus, binds to the ARE sequences of proteasome subunits, and activates their transcription. Increased transcription of proteasome subunits leads to increased levels of assembled proteasome, resulting in elevated proteasome activities and function, accompanied by decreased levels of ROS and oxidized proteins as well as lifespan extension.

Similar articles

Cited by

References

    1. Petropoulou C., Chondrogianni N., Simões D., Agiostratidou G., Drosopoulos N., Kotsota V., Gonos E. S. (2000) Ann. N.Y. Acad. Sci. 908, 133–142 - PubMed
    1. Collado M., Blasco M. A., Serrano M. (2007) Cell 130, 223–233 - PubMed
    1. Chondrogianni N., Gonos E. S. (2005) Exp. Gerontol. 40, 931–938 - PubMed
    1. Chondrogianni N., Stratford F. L., Trougakos I. P., Friguet B., Rivett A. J., Gonos E. S. (2003) J. Biol. Chem. 278, 28026–28037 - PubMed
    1. Chondrogianni N., Gonos E. S. (2004) Biogerontology 5, 55–61 - PubMed

Publication types

MeSH terms

LinkOut - more resources