. 2010 Jan 15;16(2):474-85.
doi: 10.1158/1078-0432.CCR-09-1322. Epub 2010 Jan 12.

HER2-specific T cells target primary glioblastoma stem cells and induce regression of autologous experimental tumors

Affiliations

HER2-specific T cells target primary glioblastoma stem cells and induce regression of autologous experimental tumors

Nabil Ahmed et al. Clin Cancer Res. .

Abstract

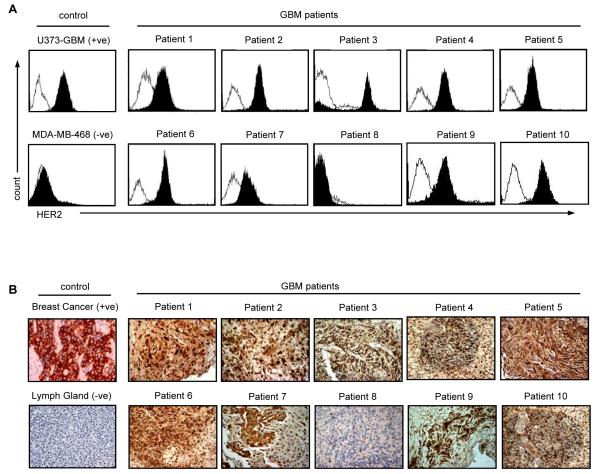
Purpose: Glioblastoma multiforme (GBM) is the most aggressive human primary brain tumor and is currently incurable. Immunotherapies have the potential to target GBM stem cells, which are resistant to conventional therapies. Human epidermal growth factor receptor 2 (HER2) is a validated immunotherapy target, and we determined if HER2-specific T cells can be generated from GBM patients that will target autologous HER2-positive GBMs and their CD133-positive stem cell compartment.

Experimental design: HER2-specific T cells from 10 consecutive GBM patients were generated by transduction with a retroviral vector encoding a HER2-specific chimeric antigen receptor. The effector function of HER2-specific T cells against autologous GBM cells, including CD133-positive stem cells, was evaluated in vitro and in an orthotopic murine xenograft model.

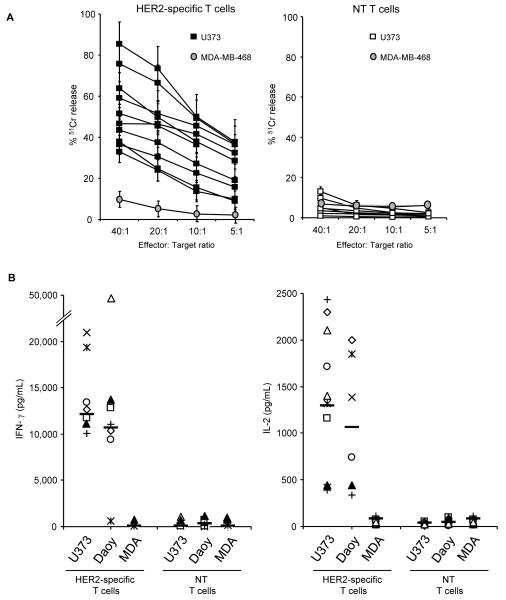
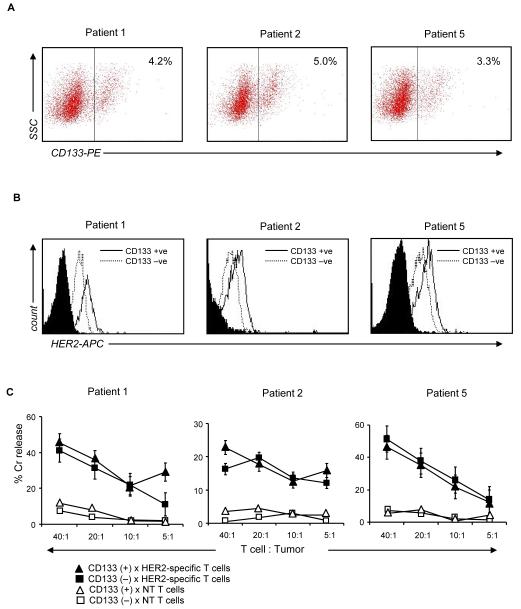
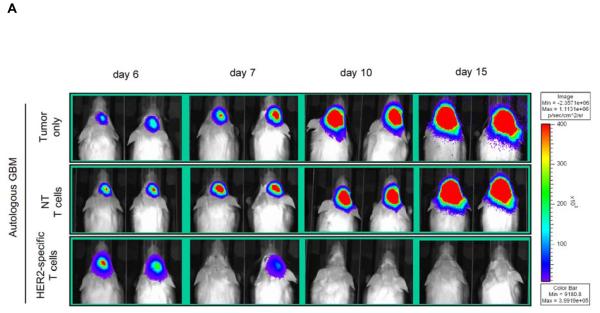
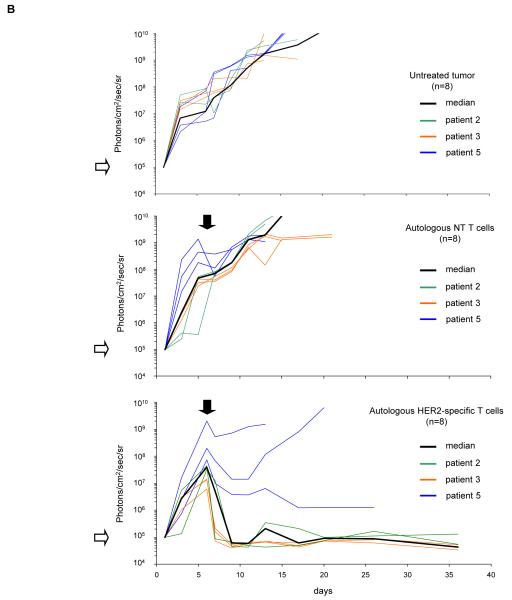
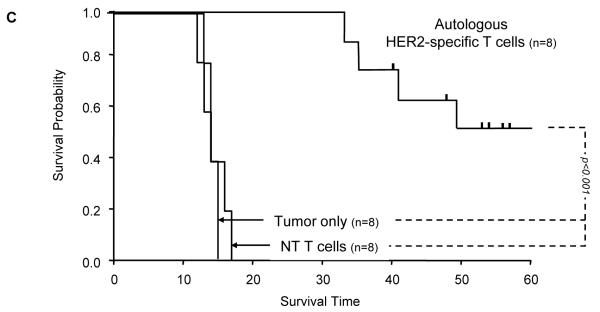
Results: Stimulation of HER2-specific T cells with HER2-positive autologous GBM cells resulted in T-cell proliferation and secretion of IFN-gamma and interleukin-2 in a HER2-dependent manner. Patients' HER2-specific T cells killed CD133-positive and CD133-negative cells derived from primary HER2-positive GBMs, whereas HER2-negative tumor cells were not killed. Injection of HER2-specific T cells induced sustained regression of autologous GBM xenografts established in the brain of severe combined immunodeficient mice.

Conclusions: Gene transfer allows the reliable generation of HER2-specific T cells from GBM patients, which have potent antitumor activity against autologous HER2-positive tumors including their putative stem cells. Hence, the adoptive transfer of HER2-redirected T cells may be a promising immunotherapeutic approach for GBM.


Figures

Figure 1
Figure 1. Functionality of HER2-specific T cells from subjects with GBM
HER2-specific and non-transduced (NT) T cells, generated from newly-diagnosed GBM patients, were co-cultured with HER2-positive (U373 or Daoy) or HER2-negative (MDA-MB-468) cells. (A) Only HER2-specific T cells killed HER2 positive targets, in a 4 hour 51Cr release cytotoxicity assay; NT T cells did not. The HER2-negative cell line MDA-MB-468 (MDA) was not killed by HER2-specific or NT T cells (mean and standard deviation for all patients are shown). Results from experiments done for 9 GBM patients in triplicates are shown. (B) in coculture assays performed at a 1:1 T-cell to tumor cell ratio, the IFN-γ and IL-2 concentration was determined in the coculture supernatant 24 to 48 hours post stimulation. Only HER2-specific T cells produced IFN-γ and IL-2 after exposure to HER2-positive cells in comparison to NT T cells. Results from experiments done in duplicates are shown.
Figure 2
Figure 2. HER2 protein expression on primary GBM
(A) FACS analysis: primary GBM cells from freshly excised tumors in short term culture were stained for HER2 expression (isotype control: open curves; HER2: solid curve. Nine out of ten tumor cell lines expressed HER2 on the cell surface. (B) Using the HER2-specific mouse monoclonal antibody NCL-L-CB11 (NovocastraTM Newcastle upon Tyne, UK), HER2 expression was confirmed on the corresponding paraffin-embedded sections. One tumor had no detectable HER2 protein expression using both methods (patient 8). Magnification 200x.
Figure 3
Figure 3. HER2-specific T cells kill autologous HER2-positive GBM and are activated in coculture
(A) The cytolytic activity of T cells expressing HER2 CAR was determined in a standard 4 hour chromium release assay. There was always an increase of cytolytic activity of HER2-specific T cells above background (non-transduced (NT) T cells) against autologous HER2-positive GBMs. As controls the HER2-positive GBM cell lines, U373, and the HER2 negative MDA-MB-468 (MDA) were used. HER2-specific T cells from all patients killed U373 cells where as MDA was not killed (shown for patient 4). (B) HER2-specific T cells (solid bars) or non-transduced (NT-T cells; open bars) from GBM patients were cocultured with autologous tumor cells or HER2-negative control cells (MDA-MB-468; hatched bars) in a 1:1 ratio. 24 to 48 hours after stimulation the cytokine concentration in the media was determined by ELISA. HER2-specific T cells produced IFN-γ and IL-2 after stimulation with 8 out of 9 HER2-positive tumor samples. No cytokine release was seen with NT T cells. Median cytokine levels for all patients are shown for U373 (HER2-positive control) and MDA-MB-468 (HER2-negative control). Results of experiments done in duplicates are shown.
Figure 4
Figure 4. HER2-specific T cells target primary GBM stem cells
(A) Primary GBM cells from three patients (GBM patient 2, 3 and 5) were stained for CD133 and isolated using high speed sorting. Approximately 3-5% of the total primary GBM cell population was CD133-positive. (B) This CD133-positive cell compartment was uniformly HER2-positive. Moreover, in all three tumors analyzed, the CD133 positive GBM stem cells expressed higher levels of HER2 in comparison to the CD133-negative tumor cell population. (C) In a 4 hour 51Cr release assay, HER2-specific T cells from these 3 patients killed autologous CD133-positive cells as well as their CD133-negative counterparts. Autologous non-transduced T cells induced no appreciable killing.
Figure 5
Figure 5. Adoptively transferred HER2-specific T cells induce regression of autologous GBM xenografts in vivo
5×10⁴ primary GBM cells from patients 2 (2 mice per group), 3 (3 mice per group) and 5 (3 mice per group) were injected stereotactically into the caudate nucleus of 9 to 12 week old SCID mice followed by intratumoral injection of 2×10⁶ autologous HER2-specific or non-transduced T cells (NT-T cells) 6 days after tumor inoculation. (A) Tumors grew progressively in untreated mice as shown for two representative animals (upper row) and in mice receiving non-transduced T cells (middle row), while tumors regressed over a period of 2-5 days in response to a single injection of autologous HER2-specific T cells generated from the same patient (lower row). (B) Quantitative bioluminescence imaging: Autologous HER2-specific T cells induced tumor regression when compared to NT-T cells (two-tailed P value = 0.002, Mann-Whitney U test). Solid arrows: time of T-cell injection; open arrows: background luminescence (mean~105 photon/sec/cm2/sr); n=number of animals tested in each group. (C) Kaplan-Meier survival curve: Survival analysis performed 60 days after tumor establishment. Mice treated with autologous HER2-specific T cells had a significantly longer survival probability (p<0.001) in comparison to untreated mice and mice that received NT-T cells. (D) 1×10⁴ CD133-positive GBM cells from patient 2 were injected as described above followed by intratumoral injection of 2×10⁶ autologous HER2-specific or NT-T cells 8 days after tumor inoculation. While tumors in animals treated with NT T cells (n=4) continued to grow exponentially, all of the animals treated with autologous HER2 T cell (n=4) regressed with two of these animals having no detectable tumors with in 6 days after T-cell injection.

Similar articles

Cited by

References

    1. DeAngelis LM. Brain tumors. N Engl J Med. 2001;344:114–123. - PubMed
    1. Buckner JC. Factors influencing survival in high-grade gliomas. Semin Oncol. 2003;30:10–14. - PubMed
    1. Stupp R, Mason WP, Van den Bent MJ, et al. Radiotherapy plus concomitant and adjuvant temozolomide for glioblastoma. N Engl J Med. 2005;352:987–996. - PubMed
    1. Altaner C. Glioblastoma and stem cells. Neoplasma. 2008;55:369–374. - PubMed
    1. Bao S, Wu Q, McLendon RE, et al. Glioma stem cells promote radioresistance by preferential activation of the DNA damage response. Nature. 2006;444:756–760. - PubMed

Publication types

MeSH terms