

Insufficiency of Janus kinase 2-autonomous leptin receptor signals for most physiologic leptin actions
- PMID: 20068132
- PMCID: PMC2844825
- DOI: 10.2337/db09-1556
Insufficiency of Janus kinase 2-autonomous leptin receptor signals for most physiologic leptin actions
Abstract
Objective: Leptin acts via its receptor (LepRb) to signal the status of body energy stores. Leptin binding to LepRb initiates signaling by activating the associated Janus kinase 2 (Jak2) tyrosine kinase, which promotes the phosphorylation of tyrosine residues on the intracellular tail of LepRb. Two previously examined LepRb phosphorylation sites mediate several, but not all, aspects of leptin action, leading us to hypothesize that Jak2 signaling might contribute to leptin action independently of LepRb phosphorylation sites. We therefore determined the potential role in leptin action for signals that are activated by Jak2 independently of LepRb phosphorylation (Jak2-autonomous signals).
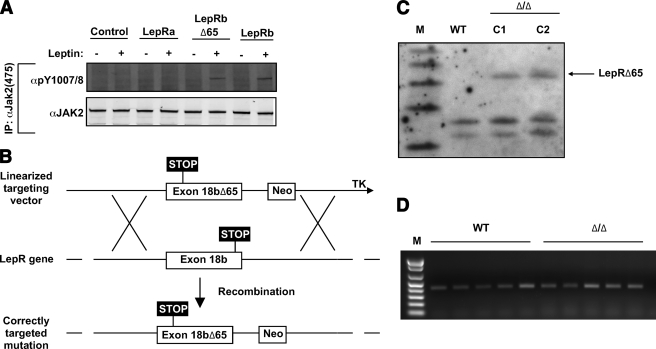
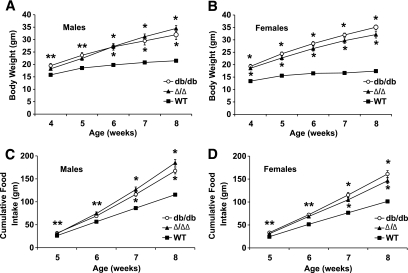
Research design and methods: We inserted sequences encoding a truncated LepRb mutant (LepRb(Delta65c), which activates Jak2 normally, but is devoid of other LepRb intracellular sequences) into the mouse Lepr locus. We examined the leptin-regulated physiology of the resulting Delta/Delta mice relative to LepRb-deficient db/db animals.
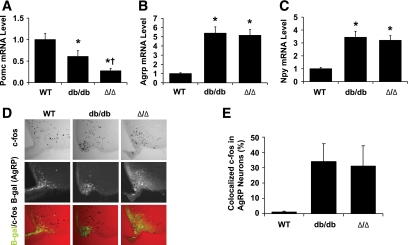
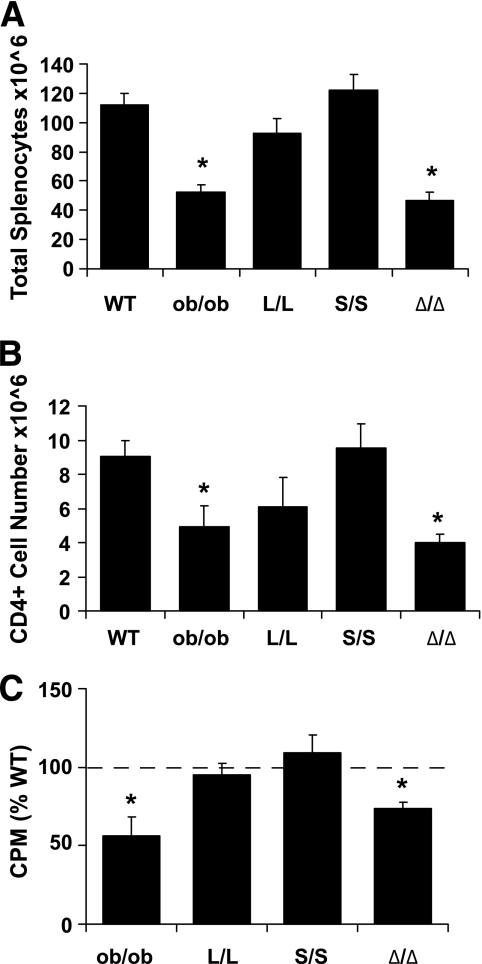
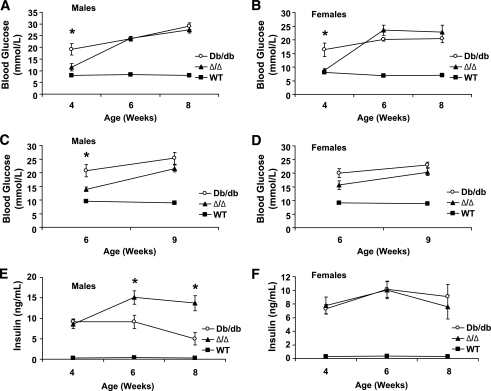
Results: The Delta/Delta animals were similar to db/db animals in terms of energy homeostasis, neuroendocrine and immune function, and regulation of the hypothalamic arcuate nucleus, but demonstrated modest improvements in glucose homeostasis.
Conclusions: The ability of Jak2-autonomous LepRb signals to modulate glucose homeostasis in Delta/Delta animals suggests a role for these signals in leptin action. Because Jak2-autonomous LepRb signals fail to mediate most leptin action, however, signals from other LepRb intracellular sequences predominate.
Figures
Similar articles
-
Leptin receptor signaling and the regulation of mammalian physiology.Int J Obes (Lond). 2008 Dec;32 Suppl 7(Suppl 7):S8-12. doi: 10.1038/ijo.2008.232. Int J Obes (Lond). 2008. PMID: 19136996 Free PMC article. Review.
-
Leptin stimulates both JAK2-dependent and JAK2-independent signaling pathways.J Biol Chem. 2008 Oct 17;283(42):28066-73. doi: 10.1074/jbc.M805545200. Epub 2008 Aug 21. J Biol Chem. 2008. PMID: 18718905 Free PMC article.
-
A spontaneous leptin receptor point mutation causes obesity and differentially affects leptin signaling in hypothalamic nuclei resulting in metabolic dysfunctions distinct from db/db mice.Mol Metab. 2019 Jul;25:131-141. doi: 10.1016/j.molmet.2019.04.010. Epub 2019 Apr 25. Mol Metab. 2019. PMID: 31076350 Free PMC article.
-
Identification of the leptin receptor sequences crucial for the STAT3-Independent control of metabolism.Mol Metab. 2020 Feb;32:168-175. doi: 10.1016/j.molmet.2019.12.013. Epub 2020 Jan 3. Mol Metab. 2020. PMID: 32029227 Free PMC article.
-
Molecular and neural mediators of leptin action.Physiol Behav. 2008 Aug 6;94(5):637-42. doi: 10.1016/j.physbeh.2008.04.005. Epub 2008 Apr 13. Physiol Behav. 2008. PMID: 18501391 Free PMC article. Review.
Cited by
-
Roles of Gangliosides in Hypothalamic Control of Energy Balance: New Insights.Int J Mol Sci. 2020 Jul 28;21(15):5349. doi: 10.3390/ijms21155349. Int J Mol Sci. 2020. PMID: 32731387 Free PMC article. Review.
-
The role of leptin in central nervous system diseases.Neuroreport. 2016 Mar 23;27(5):350-5. doi: 10.1097/WNR.0000000000000546. Neuroreport. 2016. PMID: 26885866 Free PMC article. Review.
-
Central nervous system control of metabolism.Nature. 2012 Nov 15;491(7424):357-63. doi: 10.1038/nature11705. Nature. 2012. PMID: 23151578 Review.
-
20 years of leptin: connecting leptin signaling to biological function.J Endocrinol. 2014 Oct;223(1):T25-35. doi: 10.1530/JOE-14-0404. J Endocrinol. 2014. PMID: 25232147 Free PMC article. Review.
-
Leptin revisited: its mechanism of action and potential for treating diabetes.Nat Rev Drug Discov. 2012 Sep;11(9):692-708. doi: 10.1038/nrd3757. Nat Rev Drug Discov. 2012. PMID: 22935803 Free PMC article. Review.
References
-
- Friedman JM, Halaas JL: Leptin and the regulation of body weight in mammals. Nature 1998; 395: 763– 770 - PubMed
-
- Elmquist JK, Coppari R, Balthasar N, Ichinose M, Lowell BB: Identifying hypothalamic pathways controlling food intake, body weight, and glucose homeostasis. J Comp Neurol 2005; 493: 63– 71 - PubMed
-
- Morton GJ, Cummings DE, Baskin DG, Barsh GS, Schwartz MW: Central nervous system control of food intake and body weight. Nature 2006; 443: 289– 295 - PubMed
-
- Bates SH, Myers MG, Jr: The role of leptin receptor signaling in feeding and neuroendocrine function. Trends Endocrinol Metab 2003; 14: 447– 452 - PubMed
-
- Ahima RS, Prabakaran D, Mantzoros C, Qu D, Lowell B, Maratos-Flier E, Flier JS: Role of leptin in the neuroendocrine response to fasting. Nature 1996; 382: 250– 252 - PubMed
Publication types
MeSH terms
Substances
Grants and funding
LinkOut - more resources
Full Text Sources
Molecular Biology Databases
Miscellaneous
