

Prognosis of hormone-dependent breast cancers: implications of the presence of dysfunctional transcriptional networks activated by insulin via the immune transcription factor T-bet
- PMID: 20068169
- PMCID: PMC2807987
- DOI: 10.1158/0008-5472.CAN-09-1530
Prognosis of hormone-dependent breast cancers: implications of the presence of dysfunctional transcriptional networks activated by insulin via the immune transcription factor T-bet
Abstract
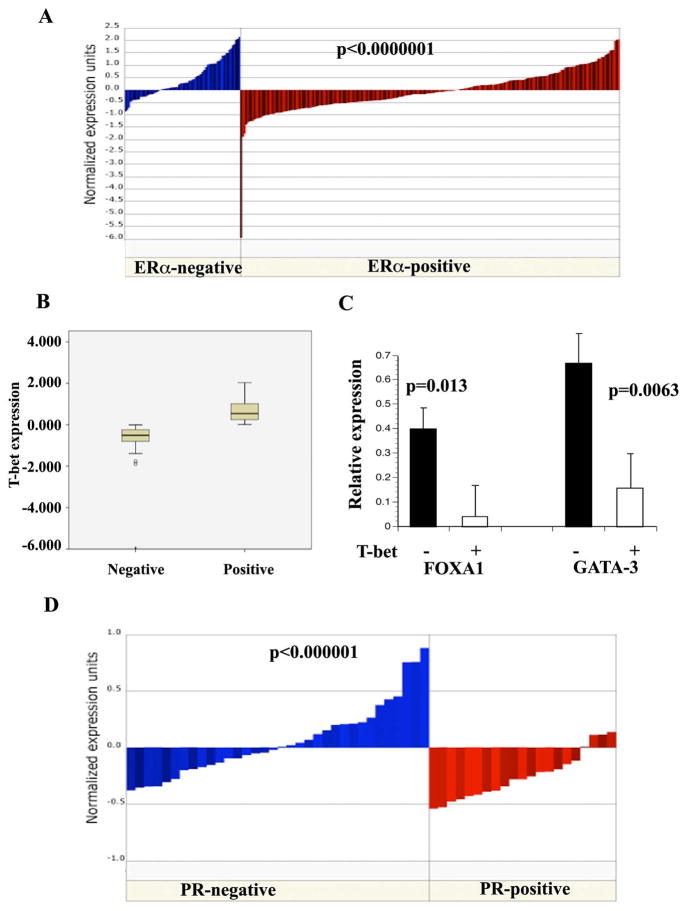
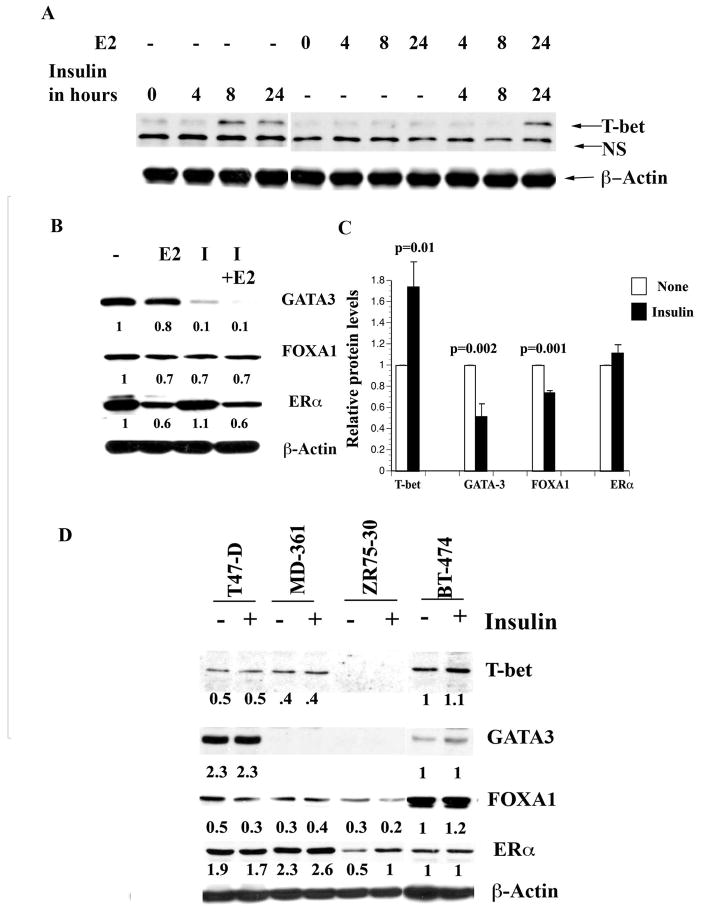
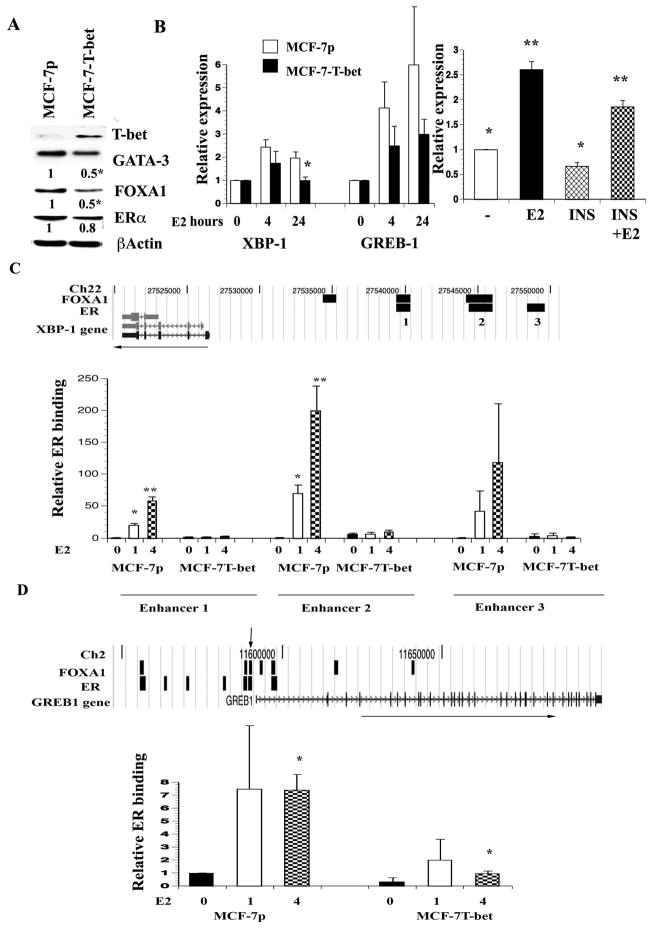
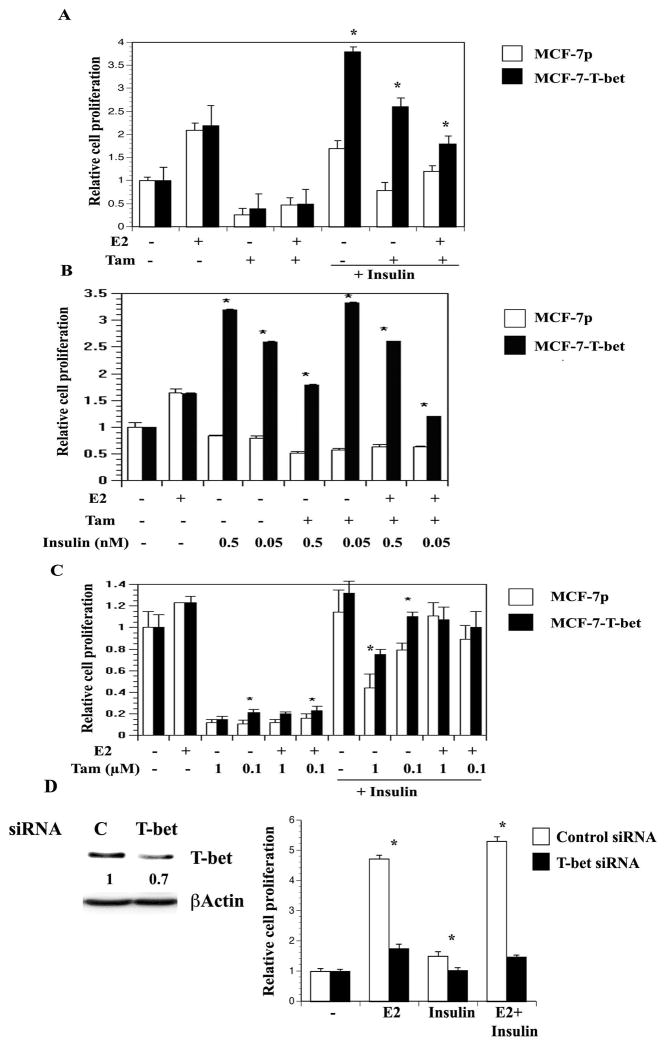
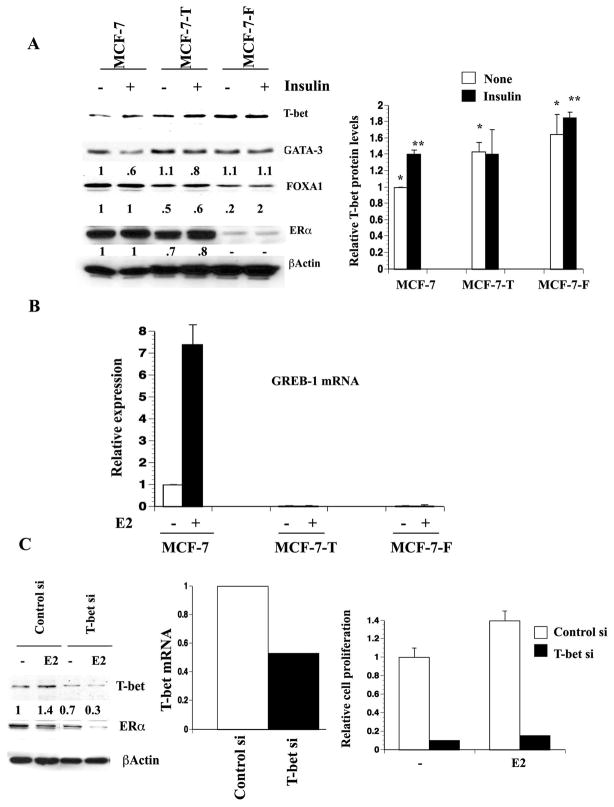
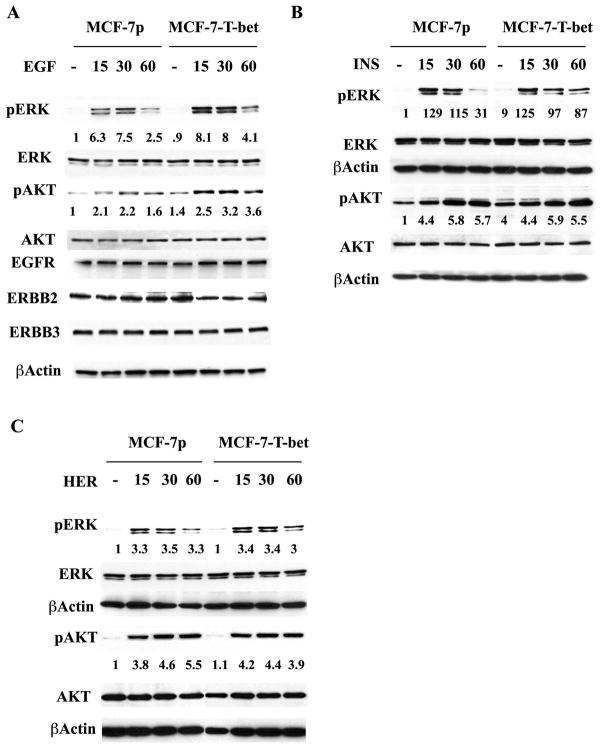
Estrogen receptor alpha (ERalpha)-positive breast cancers that co-express transcription factors GATA-3 and FOXA1 have a favorable prognosis. These transcription factors form an autoregulatory hormonal network that influences estrogen responsiveness and sensitivity to hormonal therapy. Disruption of this network may be a mechanism whereby ERalpha-positive breast cancers become resistant to therapy. The transcription factor T-bet is a negative regulator of GATA-3 in the immune system. In this study, we report that insulin increases the expression of T-bet in breast cancer cells, which correlates with reduced expression of GATA-3, FOXA1, and the ERalpha:FOXA1:GATA-3 target gene GREB-1. The effects of insulin on GATA-3 and FOXA1 could be recapitulated through overexpression of T-bet in MCF-7 cells (MCF-7-T-bet). Chromatin immunoprecipitation assays revealed reduced ERalpha binding to GREB-1 enhancer regions in MCF-7-T-bet cells and in insulin-treated MCF-7 cells. MCF-7-T-bet cells were resistant to tamoxifen in the presence of insulin and displayed prolonged extracellular signal-regulated kinase and AKT activation in response to epidermal growth factor treatment. ERalpha-positive cells with intrinsic tamoxifen resistance as well as MCF-7 cells with acquired tamoxifen and fulvestrant resistance expressed elevated levels of T-bet and/or reduced levels of FOXA1 and GATA-3. Analysis of publicly available databases revealed ERalpha-positive/T-bet-positive breast cancers expressing lower levels of FOXA1 (P = 0.0137) and GATA-3 (P = 0.0063) compared with ERalpha-positive/T-bet-negative breast cancers. Thus, T-bet expression in primary tumors and circulating insulin levels may serve as surrogate biomarkers to identify ERalpha-positive breast cancers with a dysfunctional hormonal network, enhanced growth factor signaling, and resistance to hormonal therapy.
Figures
Similar articles
-
Association of double-positive FOXA1 and FOXP1 immunoreactivities with favorable prognosis of tamoxifen-treated breast cancer patients.Horm Cancer. 2012 Aug;3(4):147-59. doi: 10.1007/s12672-012-0111-0. Epub 2012 Apr 3. Horm Cancer. 2012. PMID: 22476979 Free PMC article.
-
Delineation of a FOXA1/ERα/AGR2 regulatory loop that is dysregulated in endocrine therapy-resistant breast cancer.Mol Cancer Res. 2014 Dec;12(12):1829-39. doi: 10.1158/1541-7786.MCR-14-0195. Epub 2014 Aug 6. Mol Cancer Res. 2014. PMID: 25100862 Free PMC article.
-
Expression of FOXA1 and GATA-3 in breast cancer: the prognostic significance in hormone receptor-negative tumours.Breast Cancer Res. 2009;11(3):R40. doi: 10.1186/bcr2327. Epub 2009 Jun 23. Breast Cancer Res. 2009. PMID: 19549328 Free PMC article.
-
FOXA1 in breast cancer.Expert Rev Mol Med. 2009 Mar 5;11:e8. doi: 10.1017/S1462399409001008. Expert Rev Mol Med. 2009. PMID: 19261198 Review.
-
Adaptive hypersensitivity to estradiol: potential mechanism for secondary hormonal responses in breast cancer patients.J Steroid Biochem Mol Biol. 2001 Dec;79(1-5):115-25. doi: 10.1016/s0960-0760(01)00151-0. J Steroid Biochem Mol Biol. 2001. PMID: 11850215 Review.
Cited by
-
Association between gastric cancer and -1993 polymorphism of TBX21 gene.World J Gastroenterol. 2012 Mar 14;18(10):1117-22. doi: 10.3748/wjg.v18.i10.1117. World J Gastroenterol. 2012. PMID: 22416188 Free PMC article.
-
Antiestrogen Resistant Cell Lines Expressing Estrogen Receptor α Mutations Upregulate the Unfolded Protein Response and are Killed by BHPI.Sci Rep. 2016 Oct 7;6:34753. doi: 10.1038/srep34753. Sci Rep. 2016. PMID: 27713477 Free PMC article.
-
Endogenous purification reveals GREB1 as a key estrogen receptor regulatory factor.Cell Rep. 2013 Feb 21;3(2):342-9. doi: 10.1016/j.celrep.2013.01.010. Epub 2013 Feb 9. Cell Rep. 2013. PMID: 23403292 Free PMC article.
-
Transcription factor networks as targets for therapeutic intervention of cancer: the breast cancer paradigm.Mol Med. 2011;17(11-12):1133-6. doi: 10.2119/molmed.2011.00315. Epub 2011 Sep 6. Mol Med. 2011. PMID: 21912809 Free PMC article. Review.
-
Dependence receptor UNC5A restricts luminal to basal breast cancer plasticity and metastasis.Breast Cancer Res. 2018 May 2;20(1):35. doi: 10.1186/s13058-018-0963-5. Breast Cancer Res. 2018. PMID: 29720215 Free PMC article.
References
-
- Desmedt C, Ruiz-Garcia E, Andre F. Gene expression predictors in breast cancer: current status, limitations and perspectives. Eur J Cancer. 2008;44:2714–20. - PubMed
-
- Badve S, Nakshatri H. Oestrogen-receptor-positive breast cancer: towards bridging histopathological and molecular classifications. J Clin Pathol. 2009;62:6–12. - PubMed
-
- Sotiriou C, Wirapati P, Loi S, et al. Gene expression profiling in breast cancer: understanding the molecular basis of histologic grade to improve prognosis. J Natl Cancer Inst. 2006;98:262–72. - PubMed
Publication types
MeSH terms
Substances
Grants and funding
LinkOut - more resources
Full Text Sources
Other Literature Sources
Medical
