. 2010 Jan 15;70(2):471-80.
doi: 10.1158/0008-5472.CAN-09-2863. Epub 2010 Jan 12.

Characterization of phosphoglycerate kinase-1 expression of stromal cells derived from tumor microenvironment in prostate cancer progression

Affiliations

Characterization of phosphoglycerate kinase-1 expression of stromal cells derived from tumor microenvironment in prostate cancer progression

Jianhua Wang et al. Cancer Res. .

Retraction in

Abstract

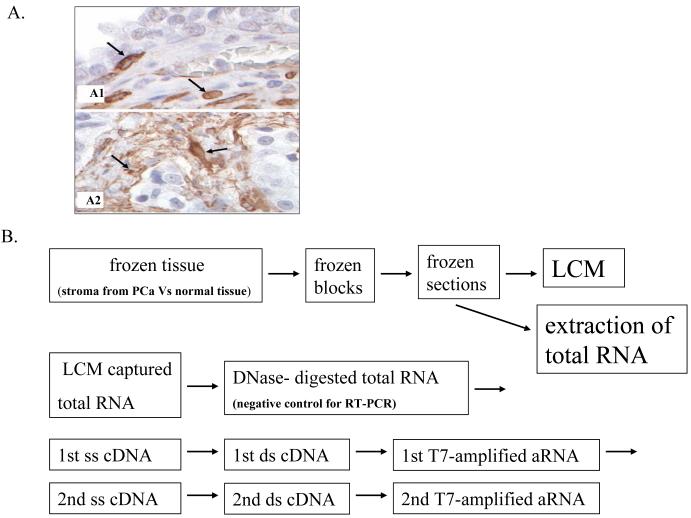
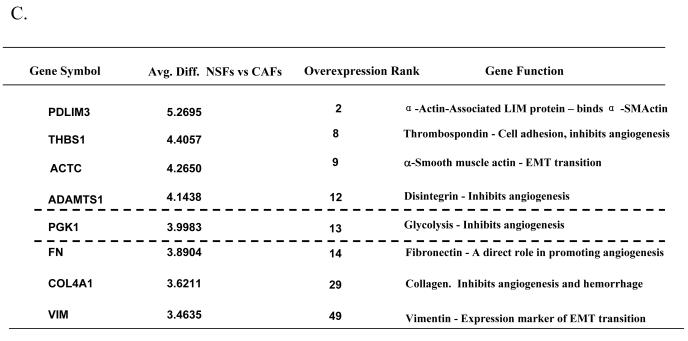
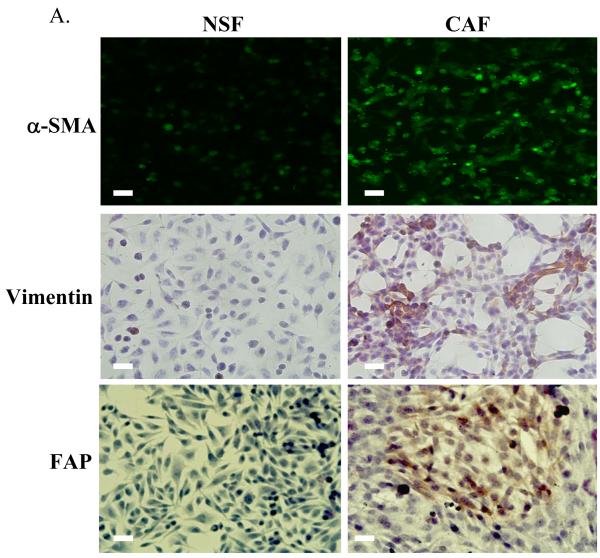
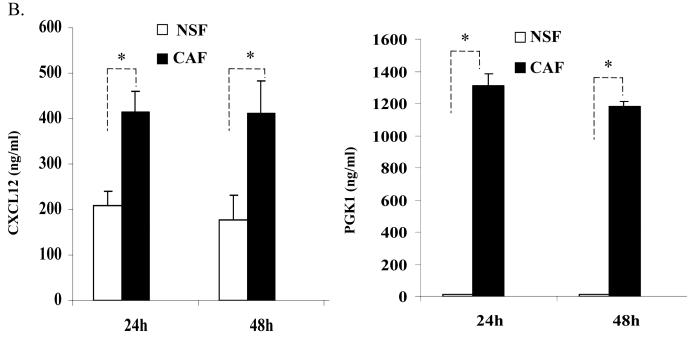
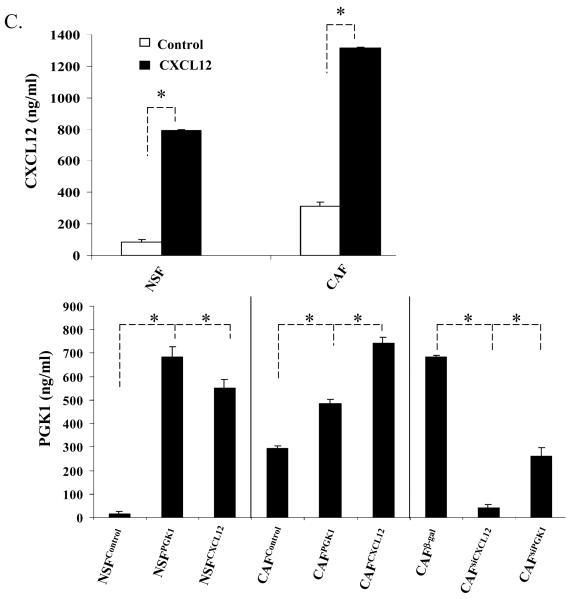
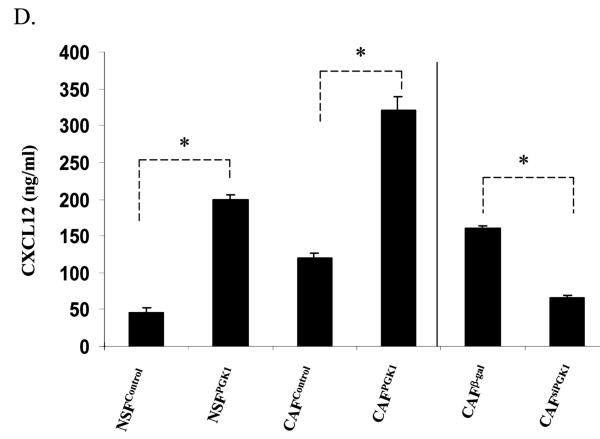
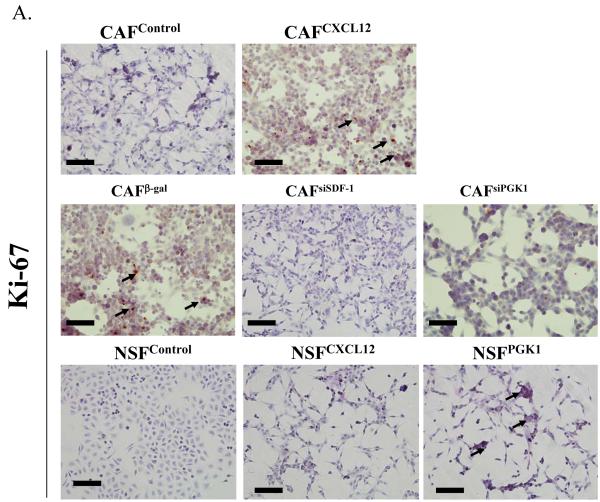
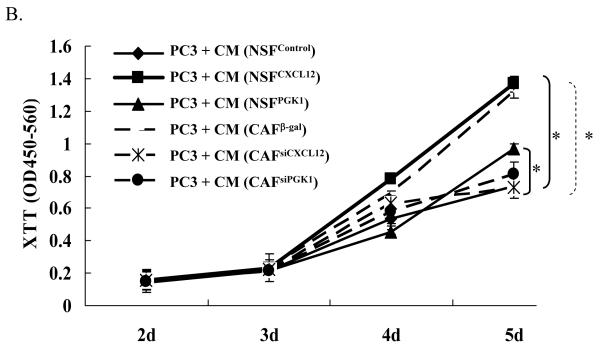
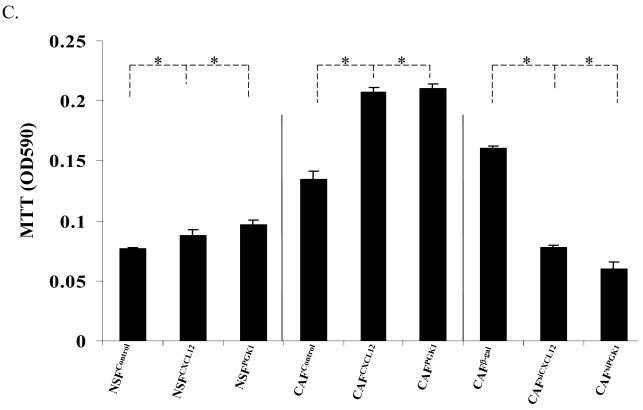
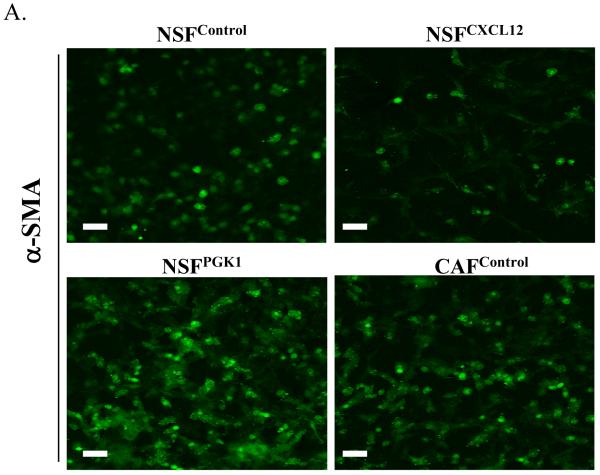
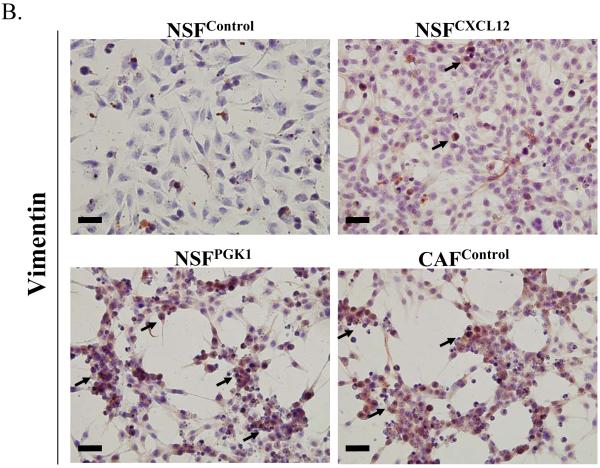
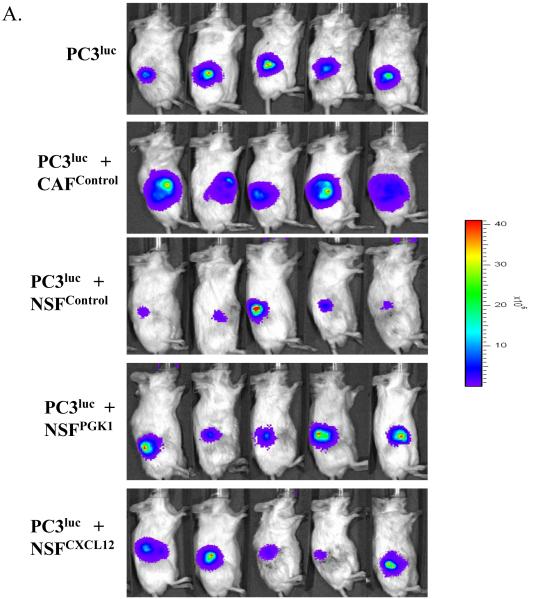
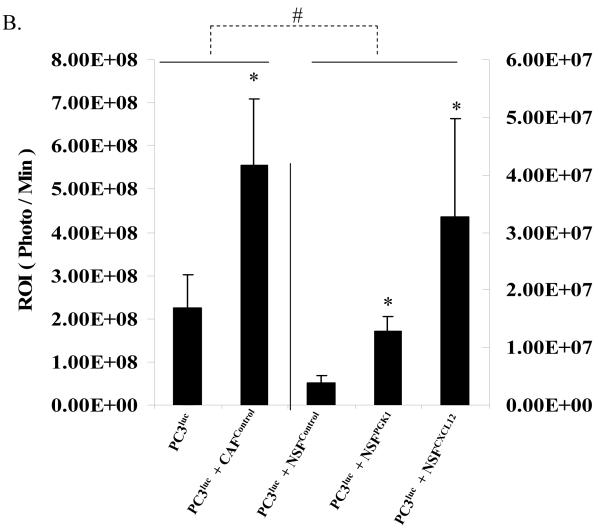
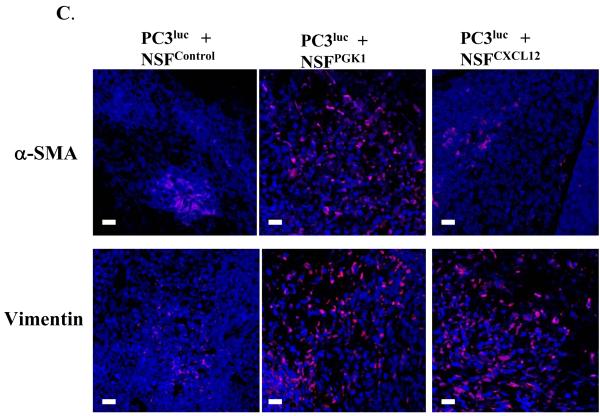
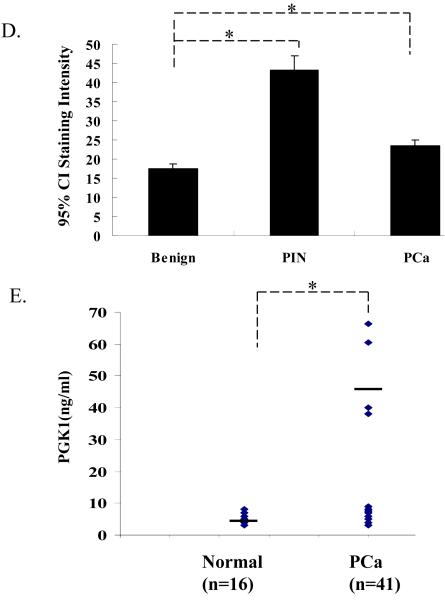
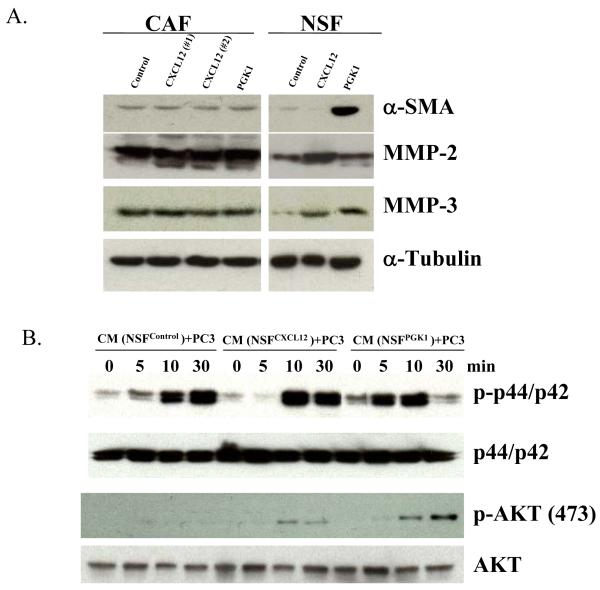
Tumor and stromal interactions in the tumor microenvironment are critical for oncogenesis and cancer progression. Our understanding of the molecular events by which reactive stromal fibroblasts-myofibroblast or cancer-associated fibroblasts (CAF)-affect the growth and invasion of prostate cancer remains unclear. Laser capture microdissection and cDNA microarray analysis of CAFs in prostate tumors revealed strong upregulation of phosphoglycerate kinase-1 (PGK1), an ATP-generating glycolytic enzyme that forms part of the glycolytic pathway and is directly involved in CXCL12-CXCR4 signaling. Normal fibroblasts overexpressing PGK1 resembled myofibroblasts in their expression of smooth muscle alpha-actin, vimentin, and high levels of CXCL12. These cells also displayed a higher proliferative index and the capability to contribute to prostate tumor cell invasion in vitro, possibly through expression of MMP-2 and MMP-3 and activation of the AKT and ERK pathways. Coimplantation of PGK1-overexpressing fibroblasts with prostate tumor cells promoted tumor cell growth in vivo. Collectively, these observations suggest that PGK1 helps support the interactions between cancer and its microenvironment.


Figures

Figure 1
Figure 1. Staining of PCa TMAs for α-SMA demonstrates a CAF transition
(A)A tissue microarray (TMA) was constructed from 30 patients to represent benign, primary, and PCa metastasis sites. Three cores (0.6 mm in diameter) were taken from each representative tissue block. The TMA was immunostained for α-SMA. Few cells in the stroma of normal prostates stained positive for α-SMA (A1, arrows). In primary PCa however, virtually all of the stromal cells stained positive for α-SMA (A2, arrows). (B) Flow chart for experimental design showing LCM, and two-rounds of T7 amplication. ssDNA, single-strand cDNA; ds cDNA, double-strand cDNA. (C)Partial summary of genes up regulated in CAFs Vs. NSFs– derived from the prostate peripheral zone.
Figure 2
Figure 2. Reciprocal expression of CXCL12 and PGK1 by tumor stromal cells
(A) Expression of α-SMA is higher in CAFs than NSFs (green staining). Representative staining of vimentin and FAP (brown) in cultures of NSFs and CAFs. Hematoxylin was used as a counterstained. Original magnification 40×, bar = 50 μM. (B) CXCL12 and PGK1 levels in NSFs and CAFs CM. CXCL12 and PGK1 levels (1×10⁶ cells / well) were evaluated by ELISA at 24h and 48h. The data are presented as mean ± std. dev. for triplicate determinations and normalized against total protein. *Denotes significant difference from respective controls (p<0.05, ANOVA). n=6 in groups. (C) and (D) ELISA assays for CXCL12 and PGK1 levels in CM derived from NSFs and CAFs which over express or have reduced levels of CXCL12 and PGK1 (denoted as NSFCXCL12, NSFPGK1/NSFControl or CAFCXCL12, CAFPGK1 / CAFControl or CAFsiCXCL12, CAFsiPGK1 / CAFβ-gal). A β-gal sequence was incorporated into the siRNA as a vector control. The data are presented as mean ± std. dev. for triplicate determinations and normalized against total protein. *Denotes significant difference from respective controls (p<0.05, ANOVA). n=6 in groups.
Figure 3
Figure 3. The role of CXCL12 and PGK1 on NSF and PCa proliferation and invasion
(A) Expression of CXCL12 or PGK1 in NSFs induces proliferation. NSFs and CAFs with altered levels of CXCL12 and PGK1 were evaluated for the expression of Ki-67 as an indicator of proliferation. Representative Ki-67 staining (brown, nuclear) is presented with Hematoxylin used as a counterstain. Original magnification 20×, where the black bars represents 100 μM. (B) Expression of CXCL12 or PGK1 in NSFs induces PCa cell proliferation. After a 24 h serum starvation, PCa cells (PC3) were washed and 1×10⁵ cells were plated. CM derived from CAF β-gal, CAFsiPGK1, CAFsiCXCL12, NSFCXCL12, or NSFPGK1 and NSFControl cells were overlaid onto the PCa cells . Proliferation was evaluated by XTT staining over a five day period. *Denotes significant difference from NSF and CAF controls (p<0.05, ANOVA) for mean ± SE of n=5 samples per condition. (C) PCa invasion regulated by CXCL12 or PGK1 expressed by NSFs. PC3 cells were placed in the top chamber of invasion plates containing a reconstituted extracellular matrix in serum-free RPMI medium, and CM derived from NSFCXCL12, NSFPGK1 and NSFControl or CAFCXCL12, CAFPGK1 and CAFControl or CAFsiCXCL12, CAFsiPGK1 and CAFβ-gal cells were added to the lower chambers. Invasion was determined at 48 h by MTT staining and the data are presented as % invasion ± standard deviation for n=5. *Denotes significant difference from invasion between alterations of CXCL12 or PGK1 expression vs. controls (p<0.05, ANOVA).
Figure 4
Figure 4. Expression of CXCL12 or PGK1 alters the phenotype of NSFs
(A) Immunofluorescence staining for α-SMA in NSFCXCL12, NSFPGK1, NSFControl, and CAFcontrol cells Expression of α-SMA (green) is higher in NSFPGK1 and CAFcontrol cells than in NSFControl cells. Original magnification 40×, where the bars represents 50 μM. (B) Vimentin staining of NSFCXCL12, NSFPGK1, NSFControl, and CAFcontrol cells. Representative immunohistochemical staining for vimentin (brown, nuclear) is presented. Original magnification 40×, where the black bars represents 50 μM.
Figure 5
Figure 5. Overexpression of CXCL12 or PGK1 in NSFs facilitates PCa growth in vivo
(A) PC3luc cells were implanted alone or mixed with NSFCXCL12, NSFPGK1, NSFControl or CAFControl cells at a ratio of 1:1 cells into the backs of NOD / SCID mice. At 4 weeks, imaging was performed by Xenogen IVIS imaging system. Luciferase signals from the representative mice are shown. (B) Quantification of tumor burdens identified by bioluminescence imaging. Increasing tumor size was observed after co-injection NSFCXCL12 or NSFPGK1 compared with NSFControl cells. Co-implantation of CAFControl cells served as a positive control. * Significant difference from control at p < 0.05. # Significant difference from presence of CAFControl or PC3 alone at p < 0.05. (C) Immunofluorensence staining for CAF markers α-SMA and Vimentin in tumor stroma from NSFControl, NSFCXCL12, and NSFPGK1 mixed with PC3luc. Nuclei were identified by DAPI. All images were captured on Zeiss LSM 510 meta confocal laser scanning microscope. Original magnification 60×, where the bars represent 30 μM. (D) Quantitative evaluation of the expression of PGK1 in human PCa. Immunostaining intensity was scored as either absent (1), weak (2), moderate (3), or strong (4). The mean expression scores multiplied by % positive cells in the field (Quick’s combined score system) for all benign, PIN, localized PCa are presented in graphical format using error bars with 95% confidence intervals (CI). Statistically significant differences were noted between benign hyperplasia (BPH) and PIN, or localize cancer for P < 0.05 (*). (E) ELISA analysis of PGK1 level in serum of normal controls and PCa patients. The data are presented as mean ± std. dev. for triplicate determinations and normalized against total protein. *Denotes significant difference from respective controls (p<0.05, ANOVA). n=3 in groups.
Figure 6
Figure 6. Molecular mechanisms of PCa progression modulated by PGK1
(A) CXCL12 or PGK1 alters the expression of α-SMA, MMP-2 , 3 in NSFs. Western blots were used to confirm the changes observed in selected mRNA levels identified in Supplemental Table 1. Whole cell lysates were immunoblotted with antibody to α-SMA, or antibodies to MMP-2 or MMP-3. Expression of α-SMA, MMP-2, 3 in CAFs were used as a positive control. The blots were stripped and reprobed with anti-α-tubulin antibody to confirm equal protein loading. (B) Evaluation of the effects of expression of CXCL12 or PGK1 in NSFs on ERK or AKT signaling. After a 24-h serum withdrawal, PCa cells treated with CM derived from NSFCXCL12, NSFPGK1 and NSFControl were assayed for ERK or AKT signaling by Western blotting at various time points. Whole cell lysates were separated on SDS-PAGE and immunoblotted with antibodies to p-ERK (p-p44/p42) or p-AKT. The blots were stripped and reblotted with antibodies against total ERK (p44/p42) AKT, respectively (top).

References

    1. Concato J, Jain D, Uchio E, et al. Molecular markers and death from prostate cancer. Ann Intern Med. 2009;150:595–603. - PubMed
    1. Hida K, Hida Y, Amin DN, et al. Tumor-associated endothelial cells with cytogenetic abnormalities. Cancer Res. 2004;64:8249–55. - PubMed
    1. Bissell MJ, Radisky D. Putting tumours in context. Nat Rev Cancer. 2001;1:46–54. - PMC - PubMed
    1. Micke P, Ostman A. Exploring the tumour environment: cancer-associated fibroblasts as targets in cancer therapy. Expert Opin Ther Targets. 2005;9:1217–33. - PubMed
    1. Orimo A, Gupta PB, Sgroi DC, et al. Stromal fibroblasts present in invasive human breast carcinomas promote tumor growth and angiogenesis through elevated SDF-1/CXCL12 secretion. Cell. 2005;121:335–48. - PubMed

Publication types

MeSH terms