. 2010 Mar 18;115(11):2241-50.
doi: 10.1182/blood-2008-06-164582. Epub 2010 Jan 12.

Bortezomib induces apoptosis in primitive chronic myeloid leukemia cells including LTC-IC and NOD/SCID repopulating cells

Affiliations

Bortezomib induces apoptosis in primitive chronic myeloid leukemia cells including LTC-IC and NOD/SCID repopulating cells

Nicholas B Heaney et al. Blood. .

Abstract

Chronic myeloid leukemia (CML) is treated effectively with tyrosine kinase inhibitors (TKIs); however, 2 key problems remain-the insensitivity of CML stem and progenitor cells to TKIs and the emergence of TKI-resistant BCR-ABL mutations. BCR-ABL activity is associated with increased proteasome activity and proteasome inhibitors (PIs) are cytotoxic against CML cell lines. We demonstrate that bortezomib is antiproliferative and induces apoptosis in chronic phase (CP) CD34+ CML cells at clinically achievable concentrations. We also show that bortezomib targets primitive CML cells, with effects on CD34+38(-), long-term culture-initiating (LTC-IC) and nonobese diabetic/severe combined immunodeficient (NOD/SCID) repopulating cells. Bortezomib is not selective for CML cells and induces apoptosis in normal CD34+38(-) cells. The effects against CML cells are seen when bortezomib is used alone and in combination with dasatinib. Bortezomib causes proteasome but not BCR-ABL inhibition and is also effective in inhibiting proteasome activity and inducing apoptosis in cell lines expressing BCR-ABL mutations, including T315I. By targeting both TKI-insensitive stem and progenitor cells and TKI-resistant BCR-ABL mutations, we believe that bortezomib offers a potential therapeutic option in CML. Because of known toxicities, including myelosuppression, the likely initial clinical application of bortezomib in CML would be in resistant and advanced disease.


Figures

Figure 1
Figure 1
Induction of apoptosis in CML cells. (A) CML CD34+ cells (n = 5) were analyzed at 24 hours of drug exposure. The viable cell count (□) is expressed as a percentage of untreated (cell count %). The percentage of cells staining positive for 7-AAD (▴) is expressed on the y-axis (% cells apoptotic). Results represent the mean ± SEM with predicted dose-response curves. (B) CML CD34+ cells (n = 3) cultured in SFM+5GF and the viable cell count (× 104 cells/mL) established at each time point as described. Results illustrated are untreated (□), and treated with 4nM (▴), 8nM (▾), and 16nM (■) bortezomib and are expressed as mean ± SEM with connecting lines. (C) Representative example of Western blot of CML CD34+ cells untreated (ND) or exposed to 10 or 20nM bortezomib (10,20) or 150nM dasatinib (Das) for 24 hours. The lower band represents the apoptosis-related PARP cleavage product. (D) CML CD34+ cells (n = 3) cultured for 24 hours in SFM+5GF and analyzed by flow cytometry to assess the percentage of cells with detectable active caspase-3 (mean ± SEM).
Figure 2
Figure 2
Effect of bortezomib on proteasome and BCR-ABL activity. (A) CML CD34+ samples (n = 2) labeled X and Y were treated for 24 hours with bortezomib 10 or 20nM (10,20) and compared with an untreated control (ND). Accumulation of polyubiquitinated proteins of various molecular weights was seen. Protein loading was assessed using antiactin antibody. The presence of significant BCR-ABL activity represented by the pCrkl band can be seen in all samples. (B) A representative CML CD34+ sample treated with bortezomib 10 or 20nM (10, 20) or dasatinib 150nM (DAS) for 24 to 48 hours and compared with untreated control (ND). The presence of the pCrkl band demonstrates the significant residual BCR-ABL kinase activity in PI-treated samples compared with the abrogated activity in the TKI-treated sample. (C) Densitometry of pCrkl (■) and ubiquitin (□) relative to protein loading control for 3 samples is shown after bortezomib 10nM (B10), dasatinib 150nM (D150), and combination treatment (mean ± SEM).
Figure 3
Figure 3
Effect of bortezomib on CD34+38 and undivided CML cells. (A) CD34+38 (n = 3) cells were cultured in SFM+5GF and analyzed at 24 hours. The viable cell count (□) is expressed as a percentage of untreated cells (cell count %). The percentage of cells staining positive for 7-AAD (▴) is expressed on the y-axis (% cells apoptotic). (B) The effect of bortezomib on CD34+38 (■) and CD34+38+ (□) cells (n = 3) was compared. The viable cell count is expressed as in panel A. (C) CD34+38 (n = 2) cells from non-CML samples were cultured in SFM+5GF and analyzed at 24 hours. The viable cell count (□) and percentage of apoptotic cells (▴) are derived as in panel A. (D) CD34+ CFSE-stained CML cells were cultured in SFM+5GF and analyzed by flow cytometry at 72 hours. Cell division peaks were calculated relative to demecolcine control. The percentage of residual viable cells in each division peak is shown for untreated (■), or treated with 150nM dasatinib (formula image
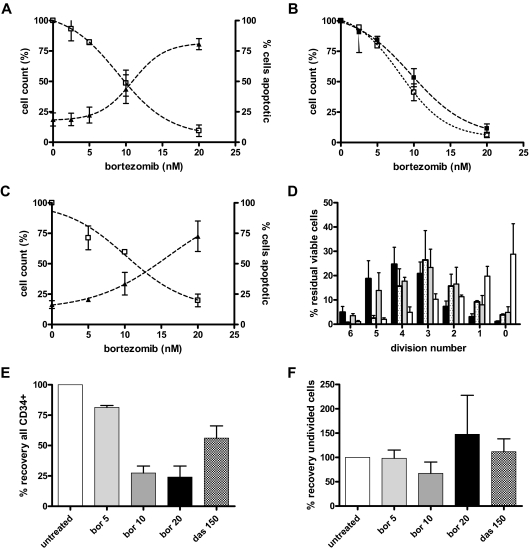
), 10nM bortezomib (▩), and 20nM bortezomib (□). Cell recovery calculations for cells from all division peaks (E) and for undivided cells (F) in untreated and treated cells (bortezomib [bor] and dasatinib [das]). All results represent mean ± SEM with predicted dose-response curves.
Figure 4
Figure 4
Effect of bortezomib on long-term colony formation and engraftment of BCR-ABL+ cells. (A) Results of LTC-IC assay in CD34+ CML (n = 2 CML samples each performed in duplicate). Results are expressed as percentage of number of colonies counted after culture of untreated cells (mean ± SEM). Cells were exposed to drug for 24 hours before long-term culture with 10nM bortezomib and 10nM dasatinib. Statistical analysis was not performed because only 2 samples were assayed. The apparent increase in colonies after dasatinib exposure is not thought to be significant. (B) Engraftment of treated CD34+ CML cells in sublethally irradiated mice. In the first experiment, 1 CML sample was exposed to no drug, bortezomib 10nM, dasatinib 10nM, or the combination of bortezomib 10nM with dasatinib 10nM for 72 hours and then injected into 4 mice per arm (ie, 16 mice; ●). In the second and third experiments, CML samples (1 per experiment) were exposed to no drug, bortezomib 20nM, dasatinib 150nM, or the combination of bortezomib 20nM with dasatinib 150nM for 24 hours and then injected into 4 mice per arm per experiment (ie, 32 mice; ○). The total number of human CD45+ cells isolated from BM at 6 weeks is shown with statistical comparison of experimental arms in comparison with untreated control. (C) The data generated from panel B are expressed as percentage of human CD45+ cells isolated from mouse BM at 6 weeks. (D) Human CD45+ cells from panel B underwent analysis by Q-PCR to determine BCR-ABL/BCR ratio. Because engraftment levels showed similar trends within each arm for the 3 CML samples assayed, the data were pooled for each treatment arm across all 3 experiments. (E) For each mouse, the percentage of CD45+ cells that is BCR-ABL+ by D-FISH is shown.
Figure 5
Figure 5
Effect of bortezomib on BCR-ABL+ cell lines. (A) Ba/F3 cells transfected with p210 (□), H396P (▴), M351T (▾) or T315I (●) BCR-ABL and cultured with bortezomib for 24 hours. Viable cell count is expressed as percentage of untreated cells. (B) BCR-ABL+ Ba/F3 cells were cultured either with no drug or treated with bortezomib 20nM for 24 hours and then stained for active caspase-3 as described. A significant increase in anti–active capase-3 staining was seen with bortezomib treatment (P values as shown). There was no significant difference within the untreated or treated groups. (C) Basal proteasome activity in untreated BCR-ABL+ Ba/F3 cells. *Statistical significance was achieved when comparing mutant forms to p210 in PG activity (P < .01 [H396P], P = .013 [M351T]) and CT-L activity (P = .047 [T315I], P = .045 [H396P], P = .038 [M351T]). (D) Residual CT-L activity in BCR-ABL+ Ba/F3 cells after exposure to 20nM bortezomib for 24 hours, expressed as percentage of untreated controls. AFU is arbitrary fluorescence units released per minute, as described. Results in panels A through C represent the mean ± SEM with predicted dose-effect curve in panel A.

Similar articles

Cited by

References

    1. Daley GQ, Van Etten RA, Baltimore D. Induction of chronic myelogenous leukemia in mice by the P210bcr/abl gene of the Philadelphia chromosome. Science. 1990;247(4944):824–830. - PubMed
    1. Evans CA, Owen-Lynch PJ, Whetton AD, Dive C. Activation of the Abelson tyrosine kinase activity is associated with suppression of apoptosis in hemopoietic cells. Cancer Res. 1993;53(8):1735–1738. - PubMed
    1. Baccarani M, Saglio G, Goldman J, et al. Evolving concepts in the management of chronic myeloid leukemia: recommendations from an expert panel on behalf of the European LeukemiaNet. Blood. 2006;108(6):1809–1820. - PubMed
    1. Hochhaus A, O'Brien SG, Guilhot F, et al. Six-year follow-up of patients receiving imatinib for the first-line treatment of chronic myeloid leukemia. Leukemia. 2009;23(6):1054–1061. - PubMed
    1. Druker BJ, Guilhot F, O'Brien SG, et al. Five-year follow-up of patients receiving imatinib for chronic myeloid leukemia. N Engl J Med. 2006;355(23):2408–2417. - PubMed

MeSH terms