

Geographic variation in one-year recurrent ischemic stroke rates for elderly Medicare beneficiaries in the USA
- PMID: 20068358
- PMCID: PMC2837886
- DOI: 10.1159/000274804
Geographic variation in one-year recurrent ischemic stroke rates for elderly Medicare beneficiaries in the USA
Abstract
Background: While geographic disparities in stroke mortality are well documented, there are no data describing geographic variation in recurrent stroke. Accordingly, we evaluated geographic variations in 1-year recurrent ischemic stroke rates in the USA with adjustment for patient characteristics.
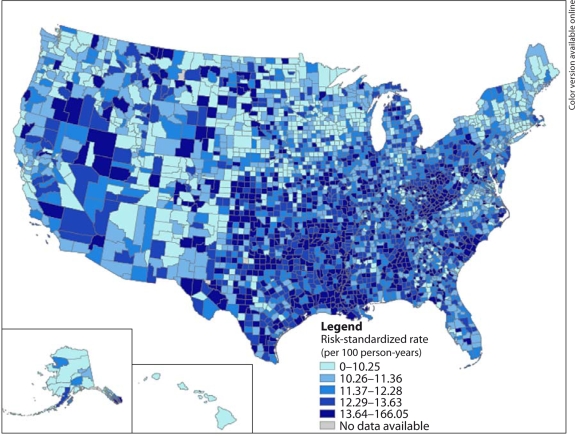
Methods: One-year recurrent stroke rates for ischemic stroke (International Classification of Diseases, 9th Revision codes 433, 434 and 436) following hospital discharge were calculated by county for all fee-for-service Medicare beneficiaries from 2000 to 2002. The rates were standardized and smoothed using a bayesian conditional autoregressive model that was risk-standardized for patients' age, gender, race/ethnicity, prior hospitalizations, Deyo comorbidity score, acute myocardial infarction, congestive heart failure, diabetes, hypertension, dementia, cancer, chronic obstructive pulmonary disease and obesity.
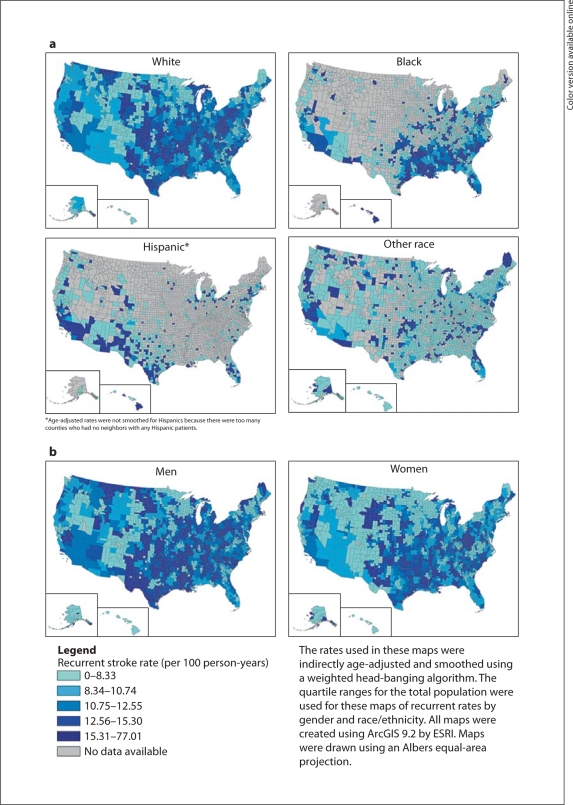
Results: The overall 1-year recurrent stroke rate was 9.4% among 895,916 ischemic stroke patients (mean age: 78 years; 56.6% women; 86.6% White, 9.7% Black and 1.2% Latino/Hispanic). The rates varied by geographic region and were highest in the South and in parts of the West and Midwest. Regional variation was present for all racial/ethnic subgroups and persisted after adjustment for individual patient characteristics.
Conclusions: Almost 1 in 10 hospitalized ischemic stroke patients was readmitted for an ischemic stroke within 1 year. There was heterogeneity in recurrence patterns by geographic region. Further work is needed to understand the reasons for this regional variability.
Copyright 2010 S. Karger AG, Basel.
Figures
Similar articles
-
Racial/Ethnic and Geographic Variations In Long-Term Survival Among Medicare Beneficiaries After Acute Ischemic Stroke.Prev Chronic Dis. 2021 Feb 18;18:E15. doi: 10.5888/pcd18.200242. Prev Chronic Dis. 2021. PMID: 33600303 Free PMC article.
-
Racial and ethnic differences in outcomes in older patients with acute ischemic stroke.Circ Cardiovasc Qual Outcomes. 2013 May 1;6(3):284-92. doi: 10.1161/CIRCOUTCOMES.113.000211. Epub 2013 May 16. Circ Cardiovasc Qual Outcomes. 2013. PMID: 23680966
-
Trends in 1-Year Recurrent Ischemic Stroke in the US Medicare Fee-for-Service Population.Stroke. 2022 Nov;53(11):3338-3347. doi: 10.1161/STROKEAHA.122.039438. Epub 2022 Oct 10. Stroke. 2022. PMID: 36214126 Free PMC article.
-
Race-Ethnic Disparities in 30-Day Readmission After Stroke Among Medicare Beneficiaries in the Florida Stroke Registry.J Stroke Cerebrovasc Dis. 2019 Dec;28(12):104399. doi: 10.1016/j.jstrokecerebrovasdis.2019.104399. Epub 2019 Oct 11. J Stroke Cerebrovasc Dis. 2019. PMID: 31611168 Free PMC article.
-
Periodontal disease, race, and vascular disease.Compend Contin Educ Dent. 2001 Jul;22(3 Spec No):34-41. Compend Contin Educ Dent. 2001. PMID: 11913250 Review.
Cited by
-
Triggering of stroke by ambient temperature variation: a case-crossover study in Maputo, Mozambique.Clin Neurol Neurosurg. 2015 Feb;129:72-7. doi: 10.1016/j.clineuro.2014.12.002. Epub 2014 Dec 17. Clin Neurol Neurosurg. 2015. PMID: 25559679 Free PMC article.
-
Using spatial analysis to demonstrate the heterogeneity of the cardiovascular drug-prescribing pattern in Taiwan.BMC Public Health. 2011 May 24;11:380. doi: 10.1186/1471-2458-11-380. BMC Public Health. 2011. PMID: 21609462 Free PMC article.
-
Geographic variation in clinical outcomes and anticoagulation among medicare beneficiaries with non-valvular atrial fibrillation.J Thromb Thrombolysis. 2023 Nov;56(4):626-634. doi: 10.1007/s11239-023-02855-1. Epub 2023 Aug 2. J Thromb Thrombolysis. 2023. PMID: 37530954 Free PMC article.
-
Epidemiology of Geographic Disparities of Myocardial Infarction Among Older Adults in the United States: Analysis of 2000-2017 Medicare Data.Front Cardiovasc Med. 2021 Sep 9;8:707102. doi: 10.3389/fcvm.2021.707102. eCollection 2021. Front Cardiovasc Med. 2021. PMID: 34568451 Free PMC article.
-
Effect of PEAR1, PTGS1 gene polymorphisms on the recurrence of aspirin-treated patients with ischemic stroke in the Han population of China: A 4-year follow-up study.Medicine (Baltimore). 2024 May 10;103(19):e38031. doi: 10.1097/MD.0000000000038031. Medicine (Baltimore). 2024. PMID: 38728491 Free PMC article.
References
-
- Lloyd-Jones D, Adams R, Carnethon M, et al. Heart disease and stroke statistics – 2009 update: a report from the American Heart Association Statistics Committee and Stroke Statistics Subcommittee. Circulation. 2009;119:480–486. - PubMed
-
- Samsa GP, Bian J, Lipscomb J, et al. Epidemiology of recurrent cerebral infarction: a Medicare claims-based comparison of first and recurrent strokes on 2-year survival and cost. Stroke. 1999;30:338–349. - PubMed
-
- Pickle LW, Mungiole M, Gillum RF. Geographic variation in stroke mortality in Blacks and Whites in the United States. Stroke. 1997;28:1639–1647. - PubMed
-
- Lanska DJ, Kryscio R. Geographic distribution of hospitalization rates, case fatality, and mortality from stroke in the United States. Neurology. 1994;44:1541–1550. - PubMed
-
- El-Saed A, Kuller LH, Newman AB, et al. Geographic variations in stroke incidence and mortality among older populations in four US communities. Stroke. 2006;37:1975–1979. - PubMed
Publication types
MeSH terms
Grants and funding
LinkOut - more resources
Full Text Sources
Other Literature Sources
Medical
