

Gene expression profiling identifies Fibronectin 1 and CXCL9 as candidate biomarkers for breast cancer screening
- PMID: 20068563
- PMCID: PMC2822945
- DOI: 10.1038/sj.bjc.6605511
Gene expression profiling identifies Fibronectin 1 and CXCL9 as candidate biomarkers for breast cancer screening
Abstract
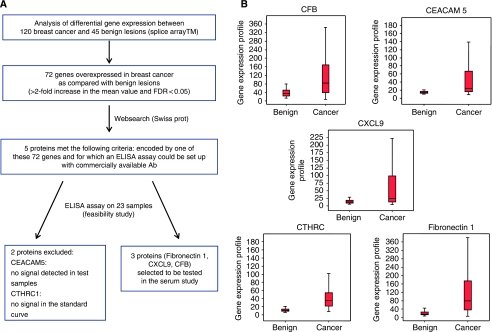
Background: There is a need to develop blood-based bioassays for breast cancer (BC) screening. In this study, differential gene expression between BC samples and benign tumours was used to identify candidate biomarkers for blood-based screening.
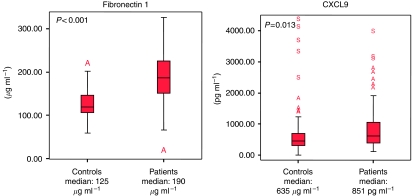
Methods: We identified two proteins (Fibronectin 1 and CXCL9) from a gene expression data set that included 120 BC samples and 45 benign lesions. These proteins fulfil the following criteria: differential gene expression between cancer and benign lesion, protein released in the extracellular medium and stable in the serum, commercially available ELISA kit, ELISA accuracy in a feasibility study. Protein concentrations were determined by ELISA. Blood samples were from normal volunteers (n=119) and early BC patients (n=133).
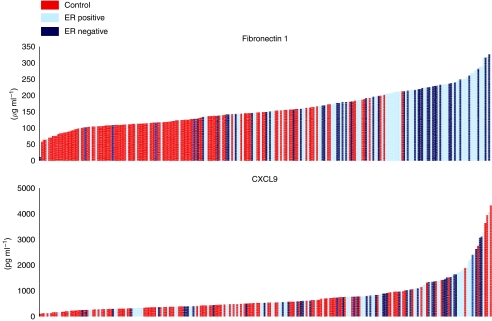
Results: Seventy-three per cent of patients had cT1-T2 tumour. Patients had higher CXCL9 and Fibronectin 1 concentrations than volunteers. CXCL9 mean concentration was 851 and 635 pg ml(-1) for patients and volunteers respectively (P=0.013). CXCL9 concentration was significantly higher in patients with estrogen receptor (ER)-negative compared with volunteers (P=0.003), data consistent with gene expression profile. Fibronectin 1 mean concentration was 190 microg ml(-1) for patients and 125 microg ml(-1) for volunteers (P<0.001). Areas under the curve for BC diagnosis were 0.78 and 0.62 for Fibronectin 1 and CXCL9 respectively. A combined score including Fibronectin 1 and CXCL9 dosages presented 53% of sensitivity and 98% of specificity. Similar performances were observed for ER-negative tumours.
Conclusions: This study suggests that Fibronectin 1/CXCL9 dosage in serum could screen a significant rate of BC, including ER-negative, and that differential gene expression analysis is a good approach to select candidate biomarkers to set up blood assays cancer screening.
Figures
References
-
- Andre F, Michiels S, Dessen P, Scott V, Suciu V, Uzan C, Lazar V, Lacroix L, Vassal G, Spielmann M, Vielh P, Delaloge S (2009) Exonic expression profile of breast tumors: a retrospective analysis of 165 samples from patients referred to a diagnosis center. Lancet Oncol 10(4): 381–390 - PubMed
-
- Bukowski RM, Rayman P, Molto L, Tannenbaum CS, Olencki T, Peereboom D, Tubbs R, McLain D, Budd GT, Griffin T, Novick A, Hamilton TA, Finke J (1999) Interferon-gamma and CXC chemokine induction by interleukin 12 in renal cell carcinoma. Clin Cancer Res 5(10): 2780–2789 - PubMed
-
- Couchman JR, Austria MR, Woods A (1990) Fibronectin–cell interaction. J Invest Dermatol 94: 7s–14s - PubMed
Publication types
MeSH terms
Substances
LinkOut - more resources
Full Text Sources
Other Literature Sources
Medical
Research Materials
