

Using relative utility curves to evaluate risk prediction
- PMID: 20069131
- PMCID: PMC2804257
- DOI: 10.1111/j.1467-985X.2009.00592.x
Using relative utility curves to evaluate risk prediction
Abstract
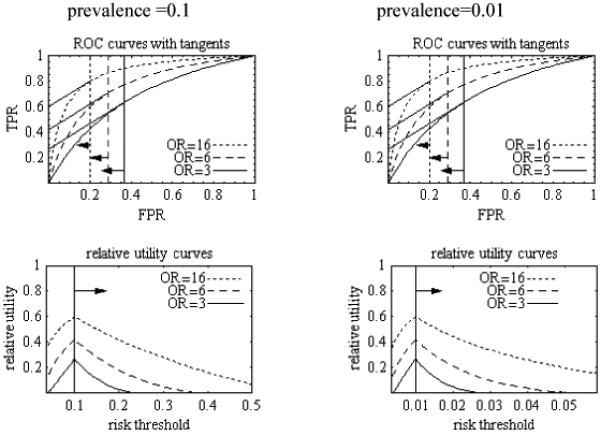
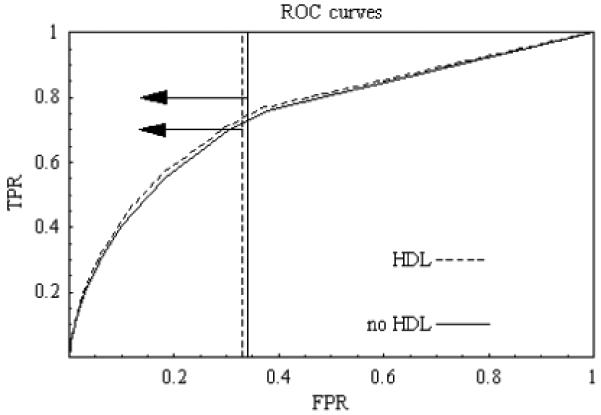
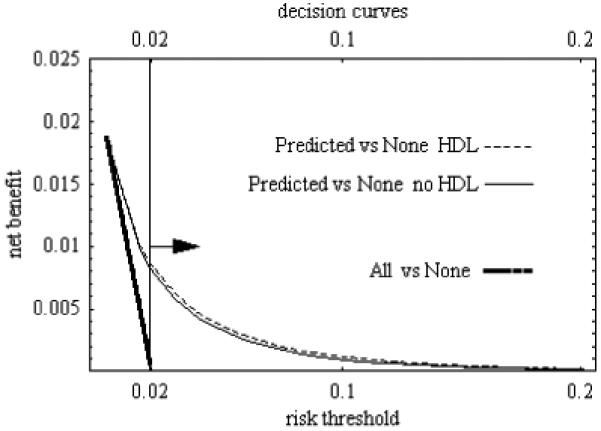
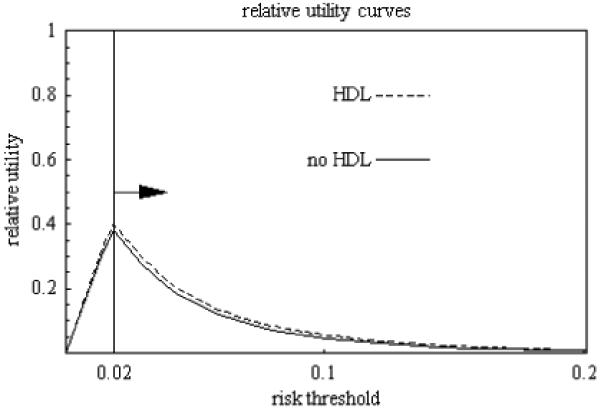
Because many medical decisions are based on risk prediction models constructed from medical history and results of tests, the evaluation of these prediction models is important. This paper makes five contributions to this evaluation: (1) the relative utility curve which gauges the potential for better prediction in terms of utilities, without the need for a reference level for one utility, while providing a sensitivity analysis for missipecification of utilities, (2) the relevant region, which is the set of values of prediction performance consistent with the recommended treatment status in the absence of prediction (3) the test threshold, which is the minimum number of tests that would be traded for a true positive in order for the expected utility to be non-negative, (4) the evaluation of two-stage predictions that reduce test costs, and (5) connections among various measures of prediction performance. An application involving the risk of cardiovascular disease is discussed.
Figures
References
-
- Adams NM, Hand DJ. Comparing classifiers when the misallocation costs are uncertain. Pattern Recognition. 1999;32:1139–1147.
-
- Briggs WM, Zaretski R. The skill plot: a graphical technique for evaluating continuous diagnostic tests. Biometrics. 2008;64:250–256. - PubMed
-
- Cook NR. Use and misuse of the receiver operating characteristic curve in risk prediction. Circulation. 2007;115:928–935. - PubMed
-
- Gail MH, Pfeiffer RM. On criteria for evaluating models for absolute risk. Biostatistics. 2005;6:227–239. - PubMed
-
- Greenhouse SW, Mantel N. The evaluation of diagnostic tests. Biometrics. 1950;6:399–412. - PubMed
Grants and funding
LinkOut - more resources
Full Text Sources