

Pre-therapeutic (124)I PET(/CT) dosimetry confirms low average absorbed doses per administered (131)I activity to the salivary glands in radioiodine therapy of differentiated thyroid cancer
- PMID: 20069293
- PMCID: PMC2854857
- DOI: 10.1007/s00259-009-1351-2
Pre-therapeutic (124)I PET(/CT) dosimetry confirms low average absorbed doses per administered (131)I activity to the salivary glands in radioiodine therapy of differentiated thyroid cancer
Abstract
Purpose: Salivary gland impairment following high activity radioiodine therapy of differentiated thyroid cancer (DTC) is a severe side effect. Dosimetric calculations using planar gamma camera scintigraphy (GCS) with (131)I and ultrasonography (US) provided evidence that the average organ dose per administered (131)I activity (ODpA) is too low to account for observed radiation damages to the salivary glands. The objective of this work was to re-estimate the ODpA using (124)I PET(/CT) as a more reliable approach than (131)I GCS/US.
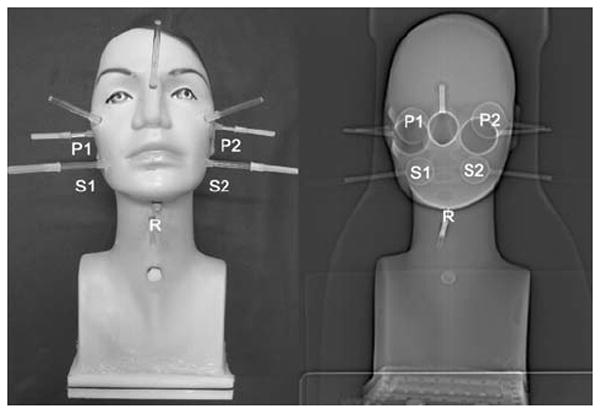
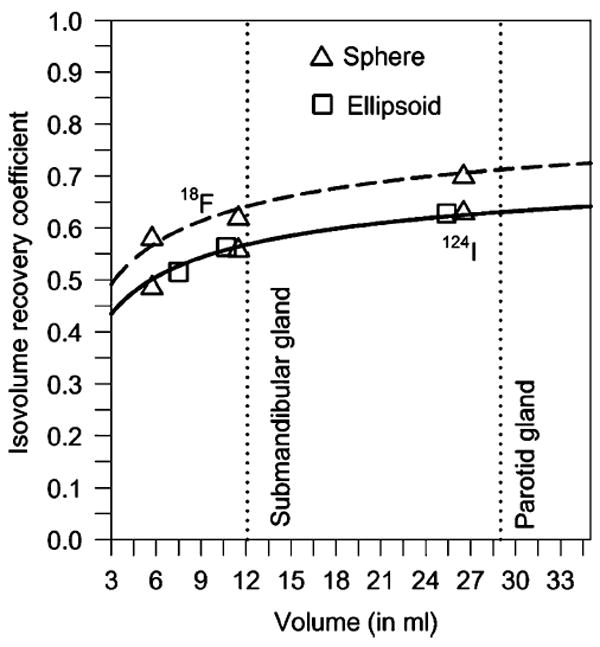
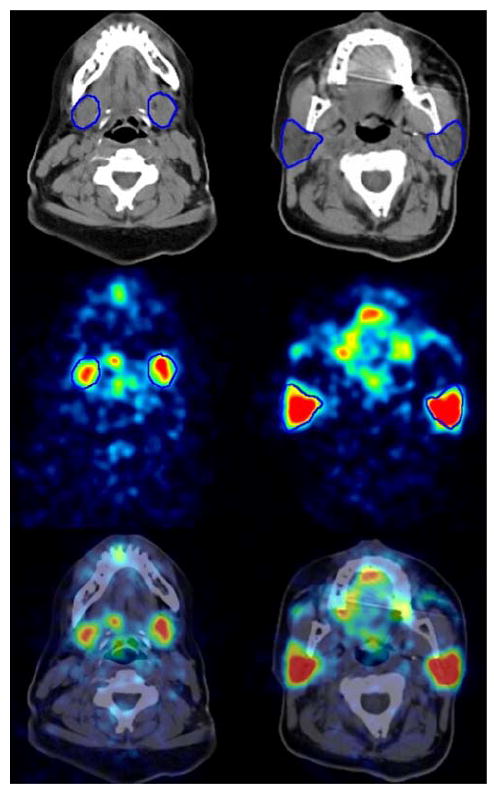
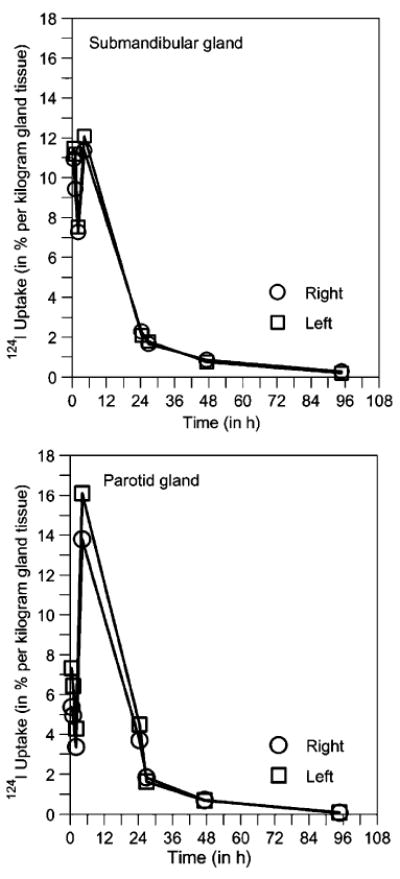
Methods: Ten DTC patients underwent a series of six (or seven) PET scans and one PET/CT scan after administration of approximately 23 MBq (124)I-iodide. Volumes of interest (VOIs) drawn on the CT and serial PET images were used to determine the glandular volumes and the imaged (124)I activities. To enable identical VOIs to be drawn on serial PET images, each PET was co-registered with the CT image. To correct for partial volume effect and for the artificial bias in the activity concentration due to cascading gamma coincidences occurring in (124)I decay, the imaged activity was effectively corrected using isovolume recovery coefficients (RCs) based on recovery phantom measurements. A head-neck phantom, which contained (124)I-filled spheres, was manufactured to validate the isovolume recovery correction method with a realistic patient-based phantom geometry and for a range of activity concentration regimes. The mean+/-standard deviation (range) ODpA projected for (131)I was calculated using the absorbed dose fraction method.
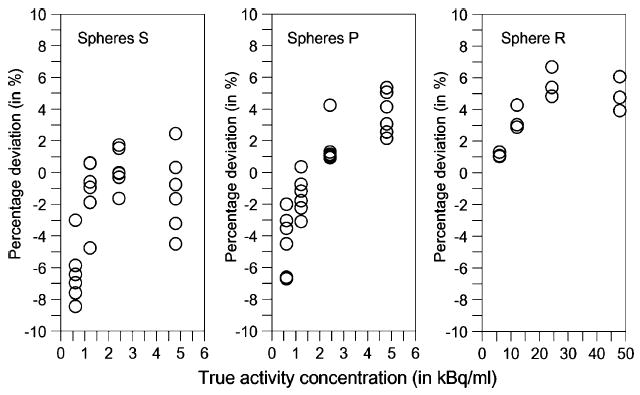
Results: The ODpAs (in Gy/GBq) for the submandibular and parotid glands were 0.32 +/- 0.13 (0.18-0.55) and 0.31 +/- 0.10 (0.13-0.46), respectively. No significant differences (p> 0.2) in the mean ODpA between (124)I PET(/CT) and (131)I GCS/US dosimetry was found. The validation experiment showed that the percentage deviations between RC-corrected and true activity concentrations were <10%.
Conclusion: (124)I PET(/CT) dosimetry also corroborates the low ODpAs to the salivary glands. A voxel-based calculation taking into account the nonuniform activity distributions in the glands is necessary to possibly explain the radiation-induced salivary gland damage.
Figures
References
-
- Hyer S, Kong A, Pratt B, Harmer C. Salivary gland toxicity after radioiodine therapy for thyroid cancer. Clin Oncol. 2007;19:83–6. - PubMed
-
- Bohuslavizki KH, Brenner W, Lassmann S, Tinnemeyer S, Tönshoff G, Sippel C, et al. Quantitative salivary gland scintigraphy in the diagnosis of parenchymal damage after treatment with radioiodine. Nucl Med Commun. 1996;17:681–86. - PubMed
-
- Bohuslavizki KH, Brenner W, Lassmann S, Tinnemeyer S, Kalina S, Clausen M, et al. Quantitative salivary gland scintigraphy—a recommended examination prior to and after radioiodine therapy (in German) Nuklearmedizin. 1997;36:103–9. - PubMed
-
- Jentzen W, Schneider E, Freudenberg L, Eising EG, Görges R, Müller SP, et al. Relationship between cumulative radiation dose and salivary gland uptake associated with radioiodine therapy of thyroid cancer. Nucl Med Commun. 2006;27:669–76. - PubMed
-
- Flux G, Bardies M, Monsieurs M, Savolainen S, Strands SE, Lassmann M, et al. The impact of PET and SPECT on dosimetry for targeted radionuclide therapy. Z Med Phys. 2006;16:47–9. - PubMed
