

Endurance time is joint-specific: a modelling and meta-analysis investigation
- PMID: 20069487
- PMCID: PMC2891087
- DOI: 10.1080/00140130903389068
Endurance time is joint-specific: a modelling and meta-analysis investigation
Abstract
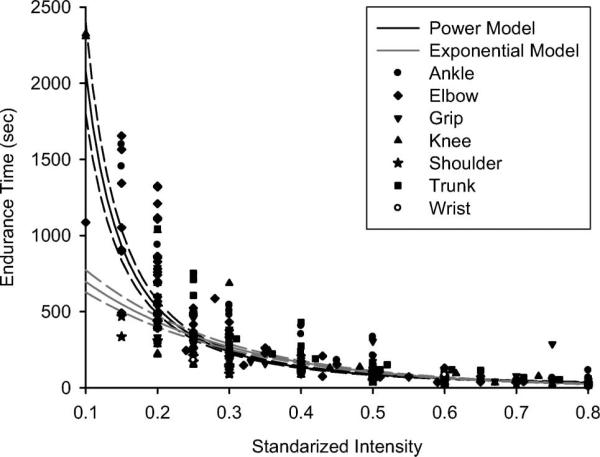
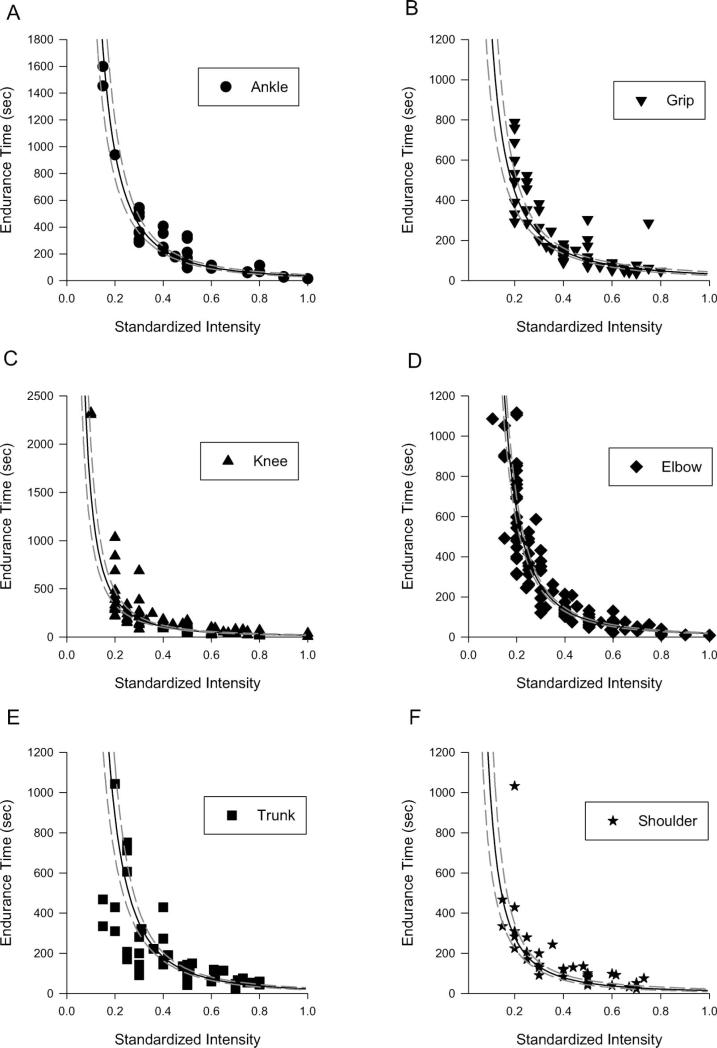
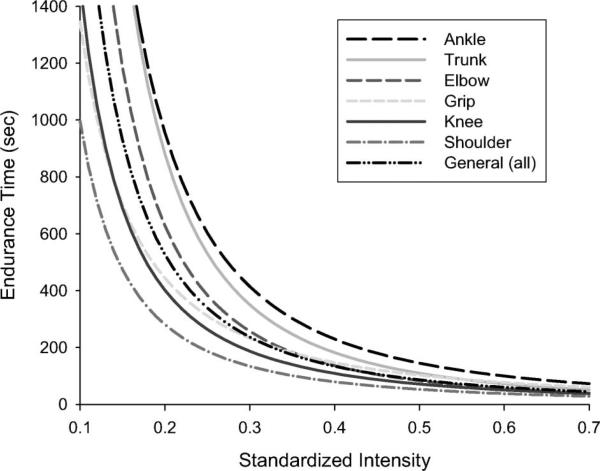
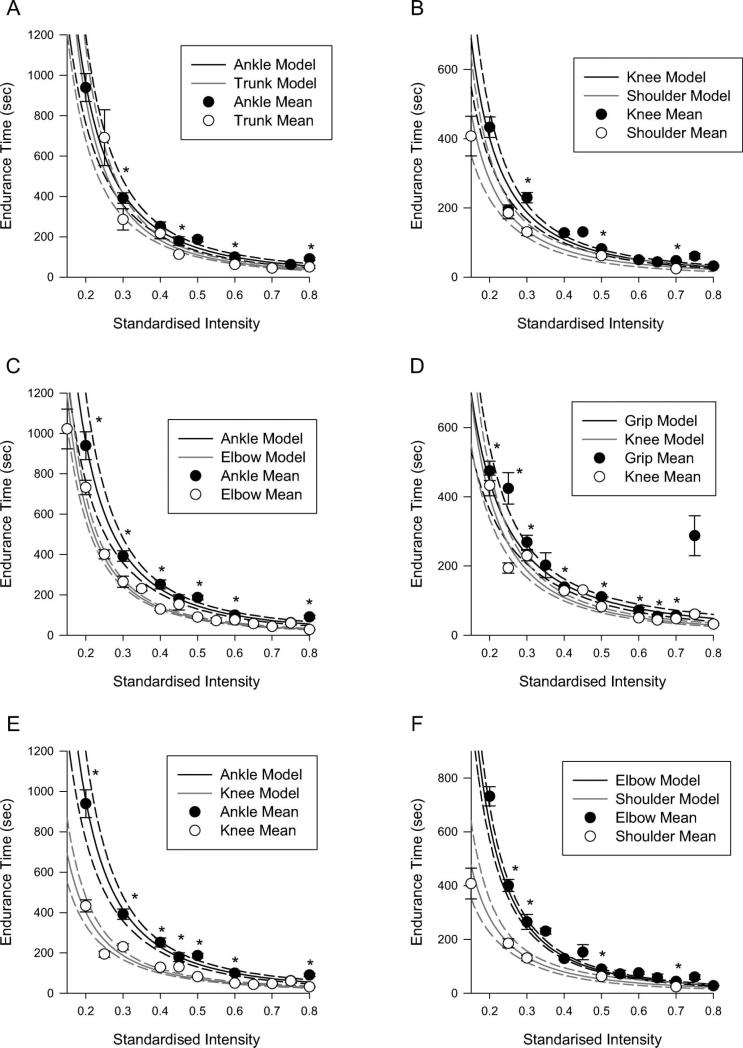
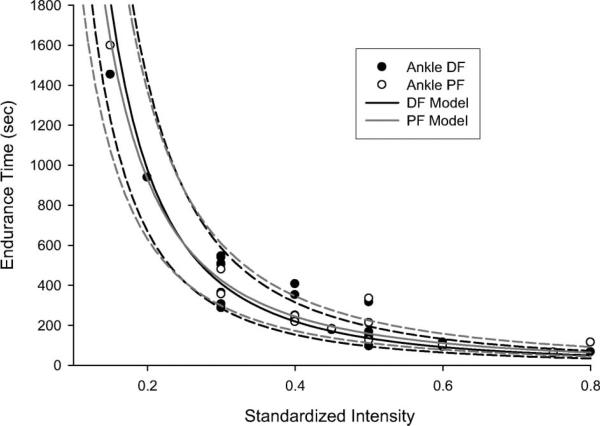
Static task intensity-endurance time (ET) relationships (e.g. Rohmert's curve) were first reported decades ago. However, a comprehensive meta-analysis to compare experimentally-observed ETs across bodily regions has not been reported. We performed a systematic literature review of ETs for static contractions, developed joint-specific power and exponential models of the intensity-ET relationships, and compared these models between each joint (ankle, trunk, hand/grip, elbow, knee, and shoulder) and the pooled data (generalised curve). 194 publications were found, representing a total of 369 data points. The power model provided the best fit to the experimental data. Significant intensity-dependent ET differences were predicted between each pair of joints. Overall, the ankle was most fatigue-resistant, followed by the trunk, hand/grip, elbow, knee and finally the shoulder was most fatigable. We conclude ET varies systematically between joints, in some cases with large effect sizes. Thus, a single generalised ET model does not adequately represent fatigue across joints. STATEMENT OF RELEVANCE: Rohmert curves have been used in ergonomic analyses of fatigue, as there are limited tools available to accurately predict force decrements. This study provides updated endurance time-intensity curves using a large meta-analysis of fatigue data. Specific models derived for five distinct joint regions should further increase prediction accuracy.
Figures
References
-
- Agre JC, Rodriquez AA. Neuromuscular function: Comparison of symptomatic and asymptomatic polio subjects to control subjects. Archives of Physical Medicine and Rehabilitation. 1990;71(8):545–551. - PubMed
-
- Alizadehkhaiyat O, et al. Strength and fatigability of selected muscles in upper limb: Assessing muscle imbalance relevant to tennis elbow. Journal of Electromyography and Kinesiology. 2007;17(4):428–436. - PubMed
-
- Alway SE. Is fiber mitochondrial volume density a good indicator of muscle fatigability to isometric exercise? Journal of Applied Physiology. 1991;70(5):2111–2119. - PubMed
-
- Bazzucchi I, et al. Differences in the force/endurance relationship between young and older men. European Journal of Applied Physiology. 2005;93(4):390–397. - PubMed
Publication types
MeSH terms
Grants and funding
LinkOut - more resources
Full Text Sources
Research Materials