

doi: 10.1002/0471142956.cy0931s51.
Measurement of phagocytosis and of the phagosomal environment in polymorphonuclear phagocytes by flow cytometry
Affiliations
- PMID: 20069529
- PMCID: PMC2827611
- DOI: 10.1002/0471142956.cy0931s51
Item in Clipboard
Measurement of phagocytosis and of the phagosomal environment in polymorphonuclear phagocytes by flow cytometry
Curr Protoc Cytom.
2010 Jan.
Abstract
Phagocytes are the most important early components of the immune response, programmed to recognize, engulf, and destroy immune complexes (formed when antibodies recognize their specific antigens), foreign particles, bacteria, mycobacteria, apoptotic cells, etc. Neutrophils, monocytes, macrophages, and dendritic cells all participate in this process. Flow cytometry permits observation of phagocytes that have responded and, with the appropriate fluorescent probes, of the environment in the phagosome that has enclosed the foreign matter. This unit gives the background and the protocols for performing such studies.
Figures
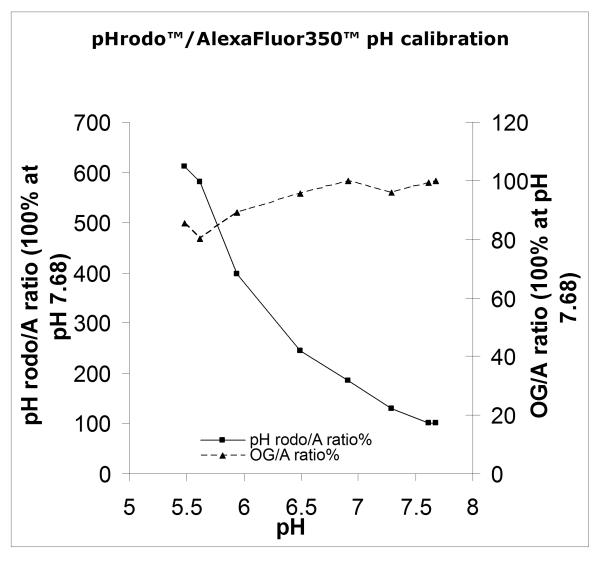
pHrodo™Bioparticles (Invitrogen/Molecular Probes) were labeled according to Protocol 1 with OregonGreen™ SE and AlexaFluor350™ SE. The fluorescence of a 1μg/ml suspension in PBS at various pH was then measured in a Hitachi 4500 spectrofluorimeter (lexc 565, 488 and 357, lem 590, 530 and 450, respectively). The ratio of F590/F450 and F530/F450 was then calculated. The fluorescence of AlexaFluor350™ did not vary detectably over the pH range. Because the ratios were too disparate to permit reasonable comparison, the % of the ratio at each pH was calculated and is plotted here, the ratios at pH7.68 being arbitrarily defined as 100%.
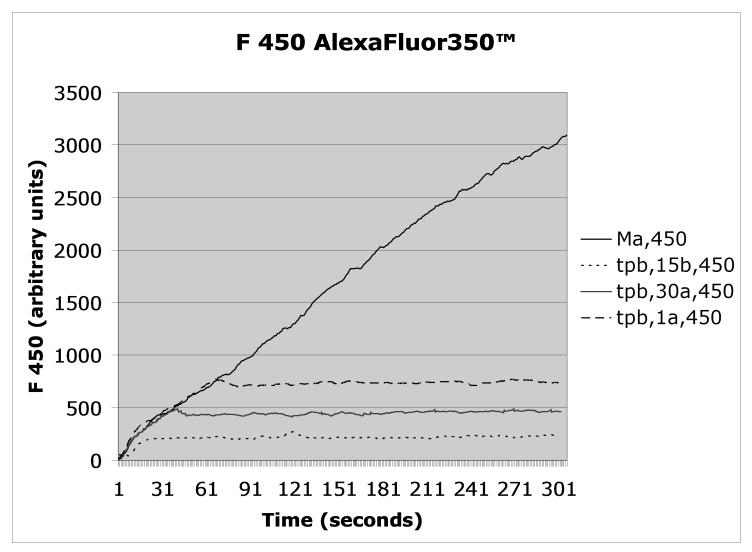
Mycobacterium avium was triple labeled with AlexaFluor350™/pHrodo™/DCF™ according to Protocol 1, opsonized with autologous serum, and added to PMN at t=0 according to Protocol 2. Fluorescence emission was recorded continuously at 450nm (Alexafluor 350), 530 nm (DCF), or 590nm (pHrodo), a shown in the respective panels. As indicated in the figures’ legends, trypan blue (tpb) was added according to Protocol 3 to distinguish between enclosed (non-quenched) and bound but not enclosed (exposed to trypan blue, therefore quenched) organisms either 15 seconds before (15b) or at the indicated times after the Mycobacterium avium suspension (one second after = 1a, 30 seconds after = 30a). The control, i.e., unquenched, fluorescence is indicated as Ma.
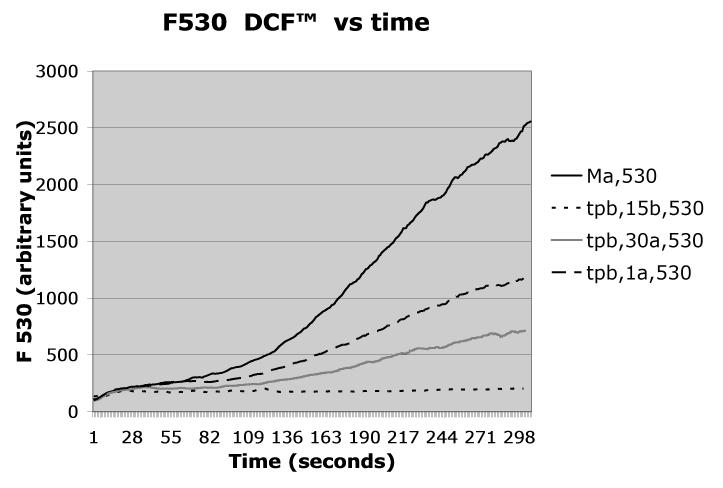
Mycobacterium avium was triple labeled with AlexaFluor350™/pHrodo™/DCF™ according to Protocol 1, opsonized with autologous serum, and added to PMN at t=0 according to Protocol 2. Fluorescence emission was recorded continuously at 450nm (Alexafluor 350), 530 nm (DCF), or 590nm (pHrodo), a shown in the respective panels. As indicated in the figures’ legends, trypan blue (tpb) was added according to Protocol 3 to distinguish between enclosed (non-quenched) and bound but not enclosed (exposed to trypan blue, therefore quenched) organisms either 15 seconds before (15b) or at the indicated times after the Mycobacterium avium suspension (one second after = 1a, 30 seconds after = 30a). The control, i.e., unquenched, fluorescence is indicated as Ma.
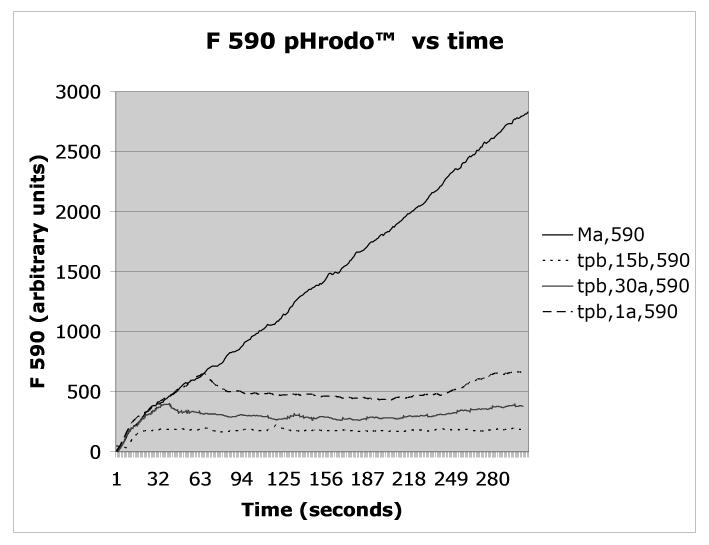
Mycobacterium avium was triple labeled with AlexaFluor350™/pHrodo™/DCF™ according to Protocol 1, opsonized with autologous serum, and added to PMN at t=0 according to Protocol 2. Fluorescence emission was recorded continuously at 450nm (Alexafluor 350), 530 nm (DCF), or 590nm (pHrodo), a shown in the respective panels. As indicated in the figures’ legends, trypan blue (tpb) was added according to Protocol 3 to distinguish between enclosed (non-quenched) and bound but not enclosed (exposed to trypan blue, therefore quenched) organisms either 15 seconds before (15b) or at the indicated times after the Mycobacterium avium suspension (one second after = 1a, 30 seconds after = 30a). The control, i.e., unquenched, fluorescence is indicated as Ma.
References
-
- Brunkhorst BA, Lazzari KG, Strohmeier G, Weil G, Simons ER. Calcium changes in immune complex-stimulated human neutrophils. Simultaneous measurement of receptor occupancy and activation reveals full population stimulus binding but subpopulation activation. J. Biol. Chem. 1991;266:13035–13043. - PubMed
-
- Brunkhorst BA, Strohmeier G, Lazzari K, Weil G, Melnick D, Fleit HB, Simons ER. Differential roles of Fc gamma RII and Fc gamma RIII in immune complex stimulation of human neutrophils. J. Biol. Chem. 1992;267:20659–20666. - PubMed
-
- Elbim C, Lizard G. Flow cytometric investigation of neutrophil oxidative burst and apoptosis physiological and pathological situation. Cytometry Part A. 2009;75A:475–481. - PubMed
-
- Fuhrmann S, Streitz M, Kern F. How Flow Cytometry is changing the study of TB immunology and clinical diagnosis. Cytometry, Part A. 2008;73A:1100–1106. - PubMed
Publication types
MeSH terms
Substances
Grants and funding
LinkOut - more resources
Full Text Sources
