. 2010 Jan:Chapter 19:Unit 19.10.1-21.
doi: 10.1002/0471142727.mb1910s89.

Galaxy: a web-based genome analysis tool for experimentalists

Affiliations

Galaxy: a web-based genome analysis tool for experimentalists

Daniel Blankenberg et al. Curr Protoc Mol Biol. 2010 Jan.

Abstract

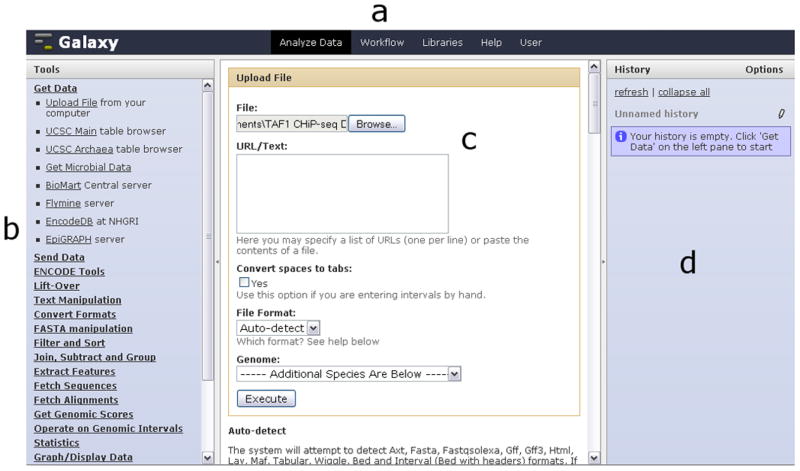
High-throughput data production has revolutionized molecular biology. However, massive increases in data generation capacity require analysis approaches that are more sophisticated, and often very computationally intensive. Thus, making sense of high-throughput data requires informatics support. Galaxy (http://galaxyproject.org) is a software system that provides this support through a framework that gives experimentalists simple interfaces to powerful tools, while automatically managing the computational details. Galaxy is distributed both as a publicly available Web service, which provides tools for the analysis of genomic, comparative genomic, and functional genomic data, or a downloadable package that can be deployed in individual laboratories. Either way, it allows experimentalists without informatics or programming expertise to perform complex large-scale analysis with just a Web browser.


Figures

Figure 1
Figure 1
Galaxy’s Analyze Data interface consists of four regions: the masthead (a) at the top, the tool menu (b) on the left-hand side, the work area (c) in the middle and the history panel (d) on the right. The Get Data section has been expanded in the tool menu and the Upload File tool has been selected. In the work area, a local file containing TAF1 CHiP-seq data has been chosen (Basic Protocol 1, step 1); clicking the “Execute” button will cause the data to be uploaded and appear in the history panel.
Figure 2
Figure 2
To change the properties of a dataset (Basic Protocol 1, step 2), click on the question mark (or the pencil icon) associated with our dataset in the history panel (a). This causes the Edit Attributes page to appear in the center panel (b) where the datatype has been changed from tabular to interval; clicking “Save” causes the page to refresh allowing additional interval-specific information to be set (c).
Figure 3
Figure 3
The UCSC Table browser tool has been selected and its interface (a) appears in the center panel; the refGene table has been selected and the output is marked to be sent to Galaxy (Basic Protocol 1, step 3). Once output style is specified (b), clicking “Send query to Galaxy” will create a new dataset in the history panel.
Figure 4
Figure 4
Selecting the Get flanks tool (Basic Protocol 1, step 4) from the Operate on Genomic Intervals Section (a) allows the creation of new data containing the region 1000 nucleotides upstream of our RefSeq genes (b).
Figure 5
Figure 5
The Join tool is used to create a dataset which contains the coordinates of putative promoters and TAF1 binding sites side by side (Basic Protocol 1, step 6).
Figure 6
Figure 6
The Build custom track tool (Basic Protocol 1, step 7) allows the user to design a custom track suitable for display at the UCSC Genome Browser (d) by progressively adding new tracks containing varying datasets (a-c).
Figure 7
Figure 7
A dataset containing exons and overlapping SNPs has been created (Basic Protocol 2, step 4) using the Join tool and has been displayed in the middle panel by clicking on the eye icon next to dataset 3. A red rectangle has been drawn around an exon which overlaps with 4 SNPs.
Figure 8
Figure 8
In order to create a workflow from an existing history (Basic Protocol 3), the user needs to make sure that they are logged in and then select “History Options” and click “Construct workflow from the current history”. A new workflow will be populated from the current history as shown; the workflow can now be renamed and created.
Figure 9
Figure 9
The Workflow Editor allows users to click to add new tools and connect the output of one tool to the input of another by simple clicking and dragging. The output of the Sort tool is being connected to the Select first tool (Basic Protocol 4, step 9), as is shown by the green rope; when the mouse button is released, the connection will be created and the rope will become white.
Figure 10
Figure 10
Several options exist for obtaining multi-species alignments (Basic Protocol 5). The Extract MAF blocks tool (a) creates a MAF dataset which contains only the trimmed alignment blocks which overlap a specified set of intervals. The Stitch MAF blocks tool (b) creates a FASTA file which contains a single alignment block per provided interval.

Similar articles

Cited by

References

    1. Karolchik D, Kuhn RM, Baertsch R, Barber GP, Clawson H, Diekhans M, Giardine B, Harte RA, Hinrichs AS, Hsu F, Miller W, Pedersen JS, Pohl A, Raney BJ, Rhead B, Rosenbloom KR, Smith KE, Stanke M, Thakkapallayil A, Trumbower H, Wang T, Zweig AS, Haussler D, Kent WJ. The UCSC Genome Browser Database: 2008 update. Nucleic Acids Res. 2008 Jan;36:D773–9. - PMC - PubMed
    1. Karolchik D, Hinrichs AS, Furey TS, Roskin KM, Sugnet CW, Haussler D, Kent WJ. The UCSC Table Browser data retrieval tool. Nucleic Acids Res. 2004 Jan 1;32(Database issue):D493–6. - PMC - PubMed
    1. Kim TH, Barrera LO, Zheng M, Qu C, Singer MA, Richmond TA, Wu Y, Green RD, Ren B. A high-resolution map of active promoters in the human genome. Nature. 2005 Aug 11;436:876–80. - PMC - PubMed
    1. Taylor J, Schenck I, Blankenberg D, Nekrutenko A. Using galaxy to perform large-scale interactive data analyses. Curr Protoc Bioinformatics. 2007 Sep;Chapter 10(Unit 10.5) - PMC - PubMed

Publication types

LinkOut - more resources