

Role of copper ion in regulating ligand binding in a myoglobin-based cytochrome C oxidase model
- PMID: 20070118
- PMCID: PMC3761084
- DOI: 10.1021/ja907777f
Role of copper ion in regulating ligand binding in a myoglobin-based cytochrome C oxidase model
Abstract
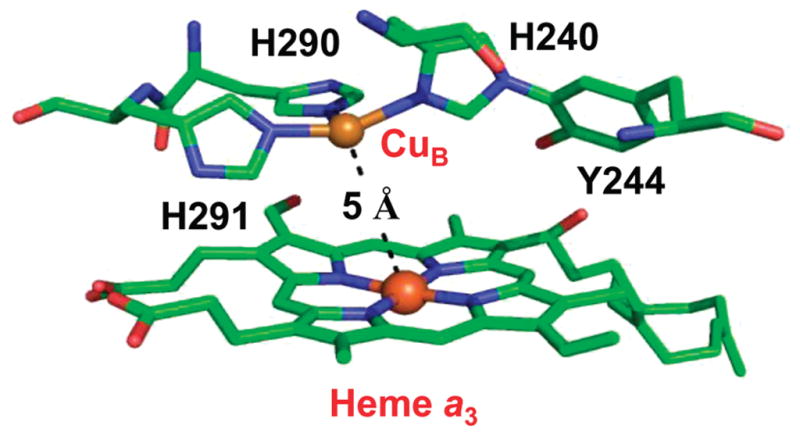
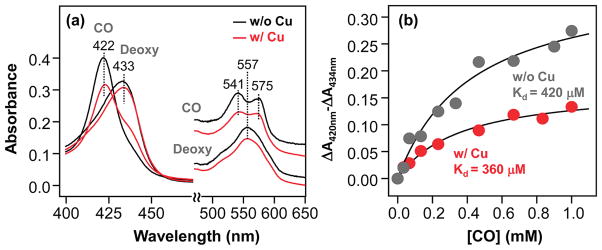
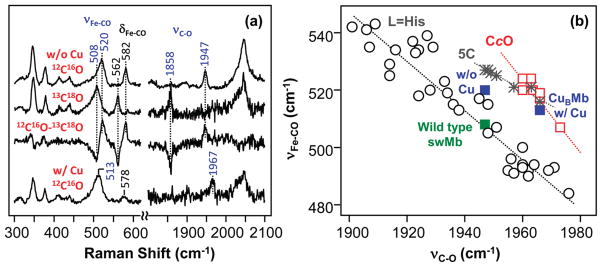
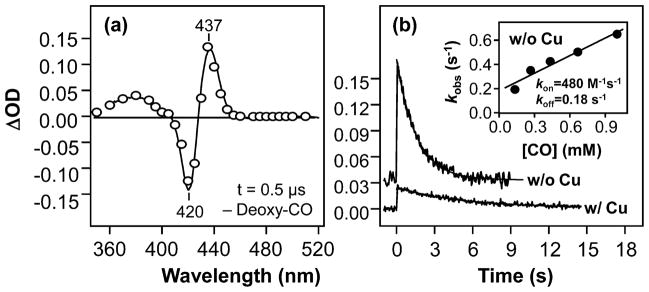
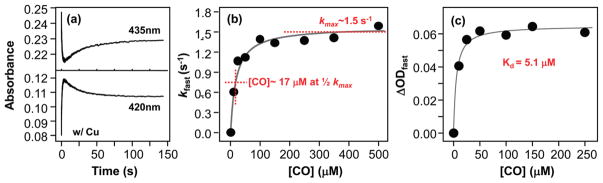
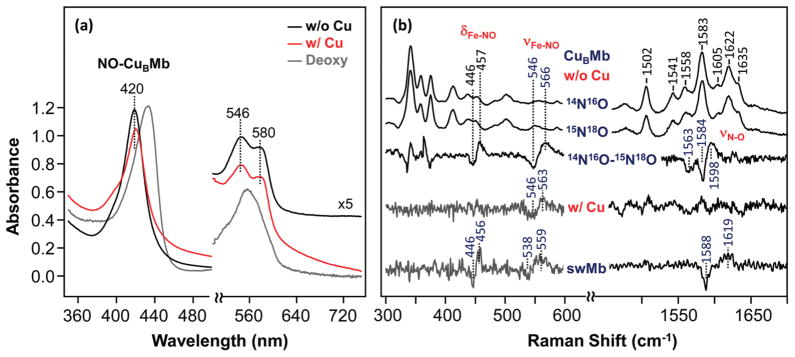
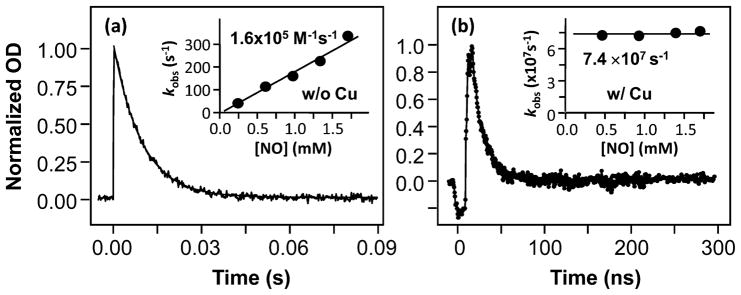
Cytochrome c oxidase (CcO), the terminal enzyme in the mitochondrial respiratory chain, catalyzes the four-electron reduction of dioxygen to water in a binuclear center comprised of a high-spin heme (heme a(3)) and a copper atom (Cu(B)) coordinated by three histidine residues. As a minimum model for CcO, a mutant of sperm whale myoglobin, named Cu(B)Mb, has been engineered, in which a copper atom is held in the distal heme pocket by the native E7 histidine and two nonnative histidine residues. In this work, the role of the copper in regulating ligand binding in Cu(B)Mb was investigated. Resonance Raman studies show that the presence of copper in CO-bound Cu(B)Mb leads to a CcO-like distal heme pocket. Stopped-flow data show that, upon the initiation of the CO binding reaction, the ligand first binds to the Cu(+); it subsequently transfers from Cu(+) to Fe(2+) in an intramolecular process, similar to that reported for CcO. The high CO affinity toward Cu(+) and the slow intramolecular CO transfer rate between Cu(+) and Fe(2+) in the Cu(B)Mb/Cu(+) complex are analogous to those in Thermus thermophilus CcO (TtCcO) but distinct from those in bovine CcO (bCcO). Additional kinetic studies show that, upon photolysis of the NO-bound Cu(B)Mb/Cu(+) complex, the photolyzed ligand transiently binds to Cu(+) and subsequently rebinds to Fe(2+), accounting for the 100% geminate recombination yield, similar to that found in TtCcO. The data demonstrate that the Cu(B)Mb/Cu(+) complex reproduces essential structural and kinetic features of CcO and that the complex is more akin to TtCcO than to bCcO.
Figures
Similar articles
-
An engineered heme-copper center in myoglobin: CO migration and binding.Biochim Biophys Acta. 2013 Sep;1834(9):1824-31. doi: 10.1016/j.bbapap.2013.02.031. Epub 2013 Feb 28. Biochim Biophys Acta. 2013. PMID: 23459127 Free PMC article.
-
Structural changes that occur upon photolysis of the Fe(II)(a3)-CO complex in the cytochrome ba(3)-oxidase of Thermus thermophilus: a combined X-ray crystallographic and infrared spectral study demonstrates CO binding to Cu(B).Biochim Biophys Acta. 2012 Apr;1817(4):658-65. doi: 10.1016/j.bbabio.2011.12.010. Epub 2011 Dec 27. Biochim Biophys Acta. 2012. PMID: 22226917 Free PMC article.
-
Effects of metal ions in the CuB center on the redox properties of heme in heme-copper oxidases: spectroelectrochemical studies of an engineered heme-copper center in myoglobin.Biochemistry. 2005 Feb 1;44(4):1210-4. doi: 10.1021/bi0479151. Biochemistry. 2005. PMID: 15667214
-
Respiratory conservation of energy with dioxygen: cytochrome C oxidase.Met Ions Life Sci. 2015;15:89-130. doi: 10.1007/978-3-319-12415-5_4. Met Ions Life Sci. 2015. PMID: 25707467 Review.
-
Hemoglobin and Myoglobin as Reducing Agents in Biological Systems. Redox Reactions of Globins with Copper and Iron Salts and Complexes.Biochemistry (Mosc). 2016 Dec;81(13):1735-1753. doi: 10.1134/S0006297916130101. Biochemistry (Mosc). 2016. PMID: 28260494 Review.
Cited by
-
Molecular understanding of heteronuclear active sites in heme-copper oxidases, nitric oxide reductases, and sulfite reductases through biomimetic modelling.Chem Soc Rev. 2021 Mar 1;50(4):2486-2539. doi: 10.1039/d0cs01297a. Chem Soc Rev. 2021. PMID: 33475096 Free PMC article. Review.
-
Spectroscopic and mutagenesis studies of human PGRMC1.Biochemistry. 2015 Mar 3;54(8):1638-47. doi: 10.1021/bi501177e. Epub 2015 Feb 23. Biochemistry. 2015. PMID: 25675345 Free PMC article.
-
Site-specific covalent attachment of heme proteins on self-assembled monolayers.J Biol Inorg Chem. 2012 Oct;17(7):1009-23. doi: 10.1007/s00775-012-0915-y. Epub 2012 Jul 4. J Biol Inorg Chem. 2012. PMID: 22760676
-
Spectroscopic characterization of mononitrosyl complexes in heme--nonheme diiron centers within the myoglobin scaffold (Fe(B)Mbs): relevance to denitrifying NO reductase.Biochemistry. 2011 Jul 5;50(26):5939-47. doi: 10.1021/bi200409a. Epub 2011 Jun 14. Biochemistry. 2011. PMID: 21634416 Free PMC article.
-
Design of Heteronuclear Metalloenzymes.Methods Enzymol. 2016;580:501-37. doi: 10.1016/bs.mie.2016.05.050. Epub 2016 Jul 26. Methods Enzymol. 2016. PMID: 27586347 Free PMC article.
References
-
- Musser SM, Stowell MH, Chan SI. Adv Enzymol Relat Areas Mol Biol. 1995;71:79–208. - PubMed
-
- Brzezinski P. Trends Biochem Sci. 2004;29:380–387. - PubMed
-
- Gennis RB. Front Biosci. 2004;9:581–591. - PubMed
-
- Iwata S, Ostermeier C, Ludwig B, Michel H. Nature. 1995;376:660–669. - PubMed
-
- Yoshikawa S, Shinzawa-Itoh K, Nakashima R, Yaono R, Yamashita E, Inoue N, Yao M, Fei MJ, Libeu CP, Mizushima T, Yamaguchi H, Tomizaki T, Tsukihara T. Science. 1998;280:1723–1729. - PubMed
Publication types
MeSH terms
Substances
Grants and funding
LinkOut - more resources
Full Text Sources
Research Materials
Miscellaneous
