

Cryptococcus neoformans responds to mannitol by increasing capsule size in vitro and in vivo
- PMID: 20070311
- PMCID: PMC2891871
- DOI: 10.1111/j.1462-5822.2010.01430.x
Cryptococcus neoformans responds to mannitol by increasing capsule size in vitro and in vivo
Abstract
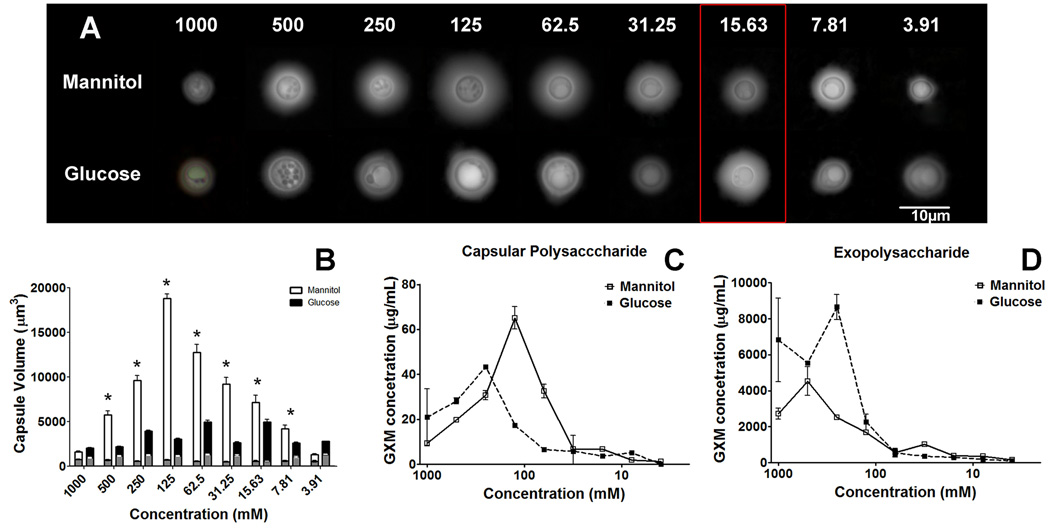
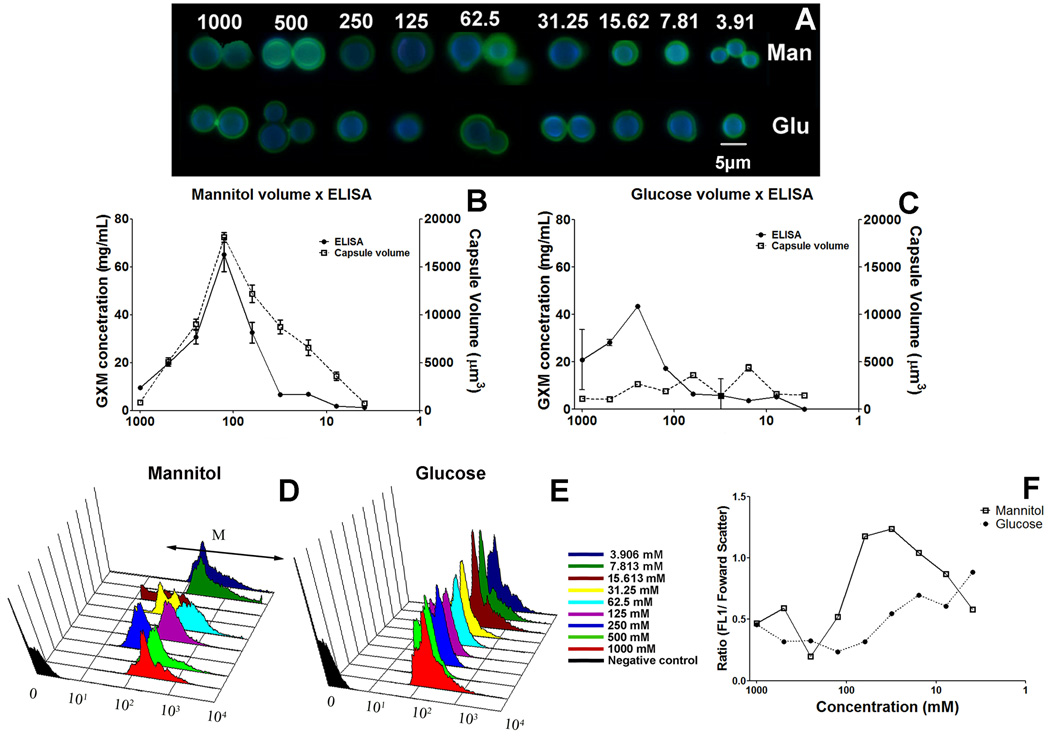
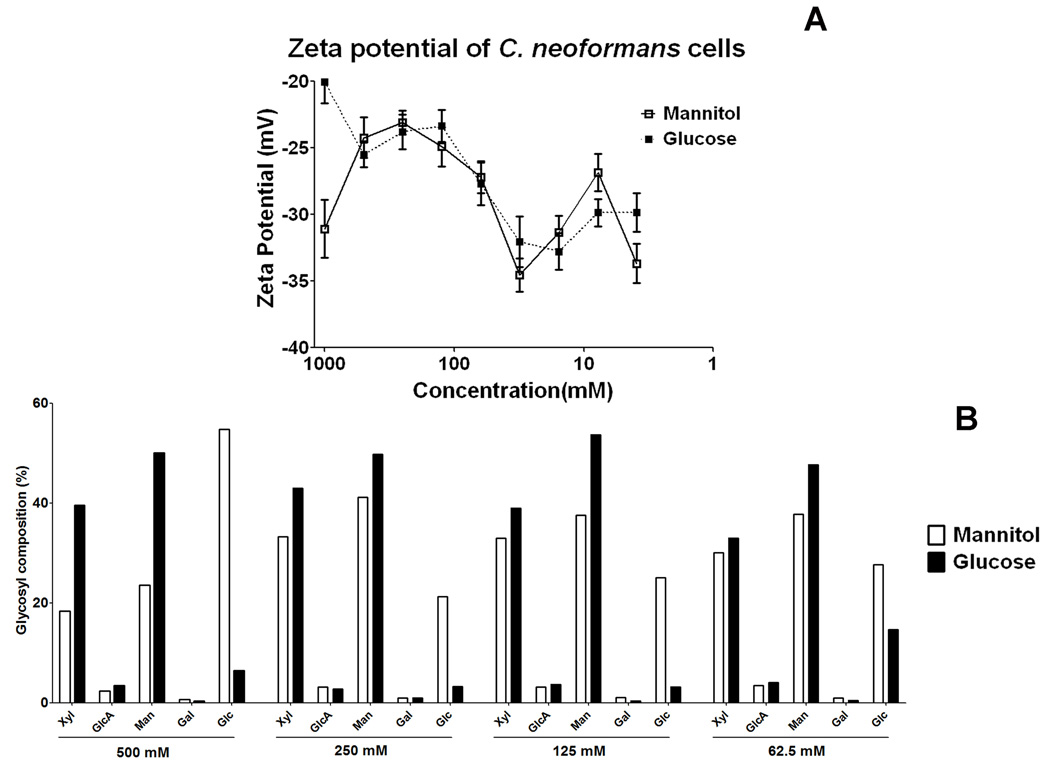
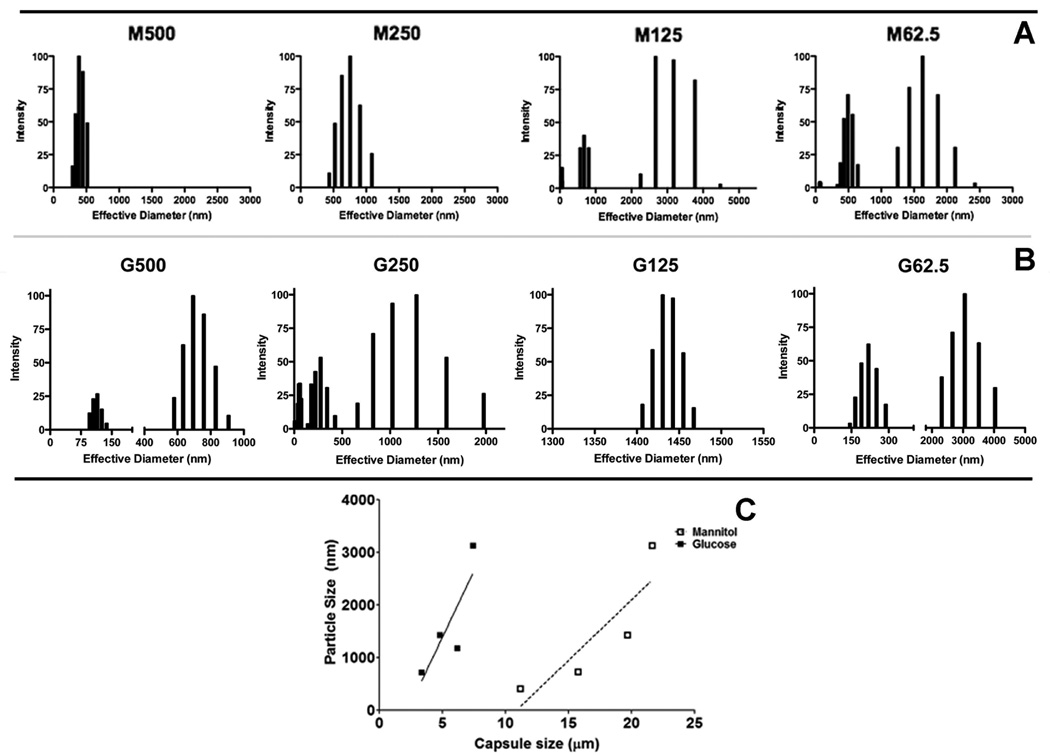
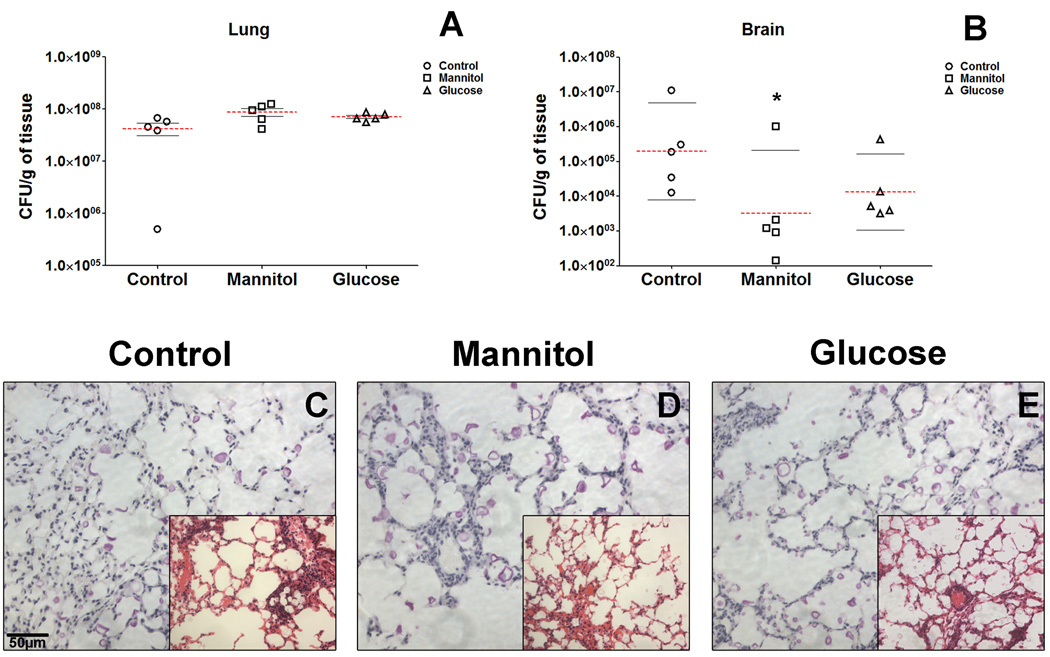
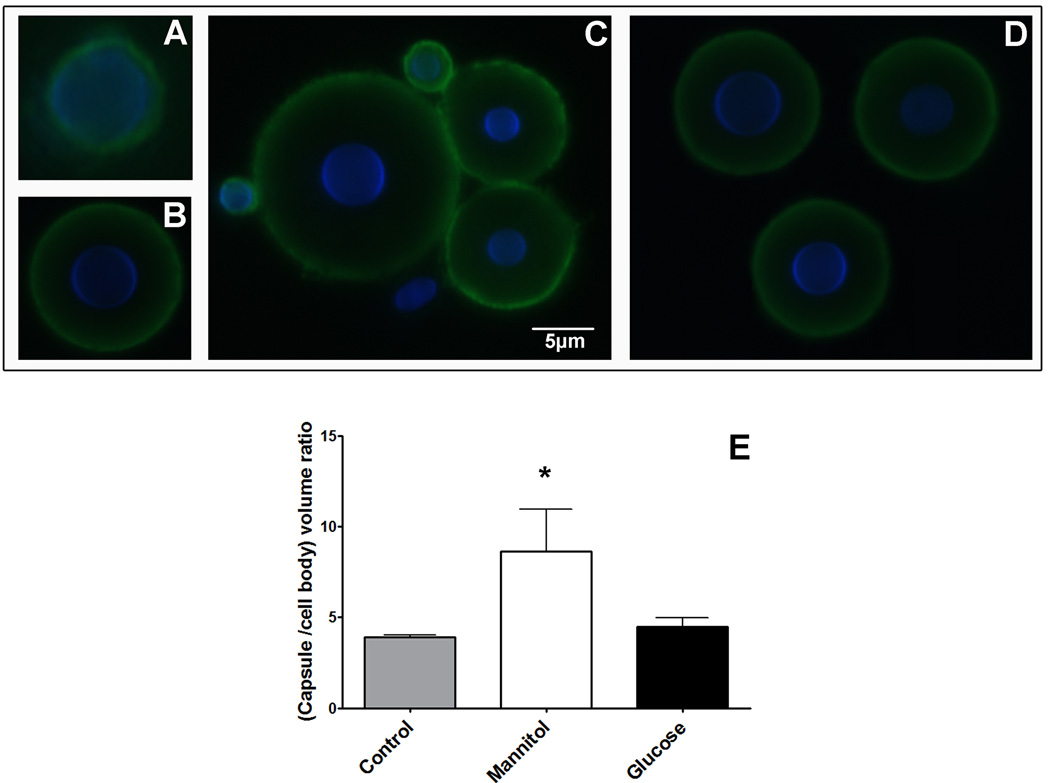
The polysaccharide capsule of the fungus Cryptococcus neoformans is its main virulence factor. In this study, we determined the effects of mannitol and glucose on the capsule and exopolysaccharide production. Growth in mannitol significantly increased capsular volume compared with cultivation in glucose. However, cells grown in glucose concentrations higher than 62.5 mM produced more exopolysaccharide than cells grown in mannitol. The fibre lengths and glycosyl composition of capsular polysaccharide from yeast grown in mannitol was structurally different from that of yeast grown in glucose. Furthermore, mannitol treatment of mice infected intratracheally with C. neoformans resulted in fungal cells with significantly larger capsules and the mice had reduced fungal dissemination to the brain. Our results demonstrate the capacity of carbohydrate source and concentration to modify the expression of a major virulence factor of C. neoformans. These findings may impact the clinical management of cryptococcosis.
Figures
Similar articles
-
UDP-Glucuronic Acid Transport Is Required for Virulence of Cryptococcus neoformans.mBio. 2018 Jan 30;9(1):e02319-17. doi: 10.1128/mBio.02319-17. mBio. 2018. PMID: 29382737 Free PMC article.
-
Capsule growth in Cryptococcus neoformans is coordinated with cell cycle progression.mBio. 2014 Jun 17;5(3):e00945-14. doi: 10.1128/mBio.00945-14. mBio. 2014. PMID: 24939886 Free PMC article.
-
Parallel beta-helix proteins required for accurate capsule polysaccharide synthesis and virulence in the yeast Cryptococcus neoformans.Eukaryot Cell. 2007 Apr;6(4):630-40. doi: 10.1128/EC.00398-06. Epub 2007 Mar 2. Eukaryot Cell. 2007. PMID: 17337638 Free PMC article.
-
Cryptococcus neoformans: virulence and host defences.Med Mycol. 1998;36 Suppl 1:79-86. Med Mycol. 1998. PMID: 9988495 Review.
-
The capsule of the fungal pathogen Cryptococcus neoformans.Adv Appl Microbiol. 2009;68:133-216. doi: 10.1016/S0065-2164(09)01204-0. Adv Appl Microbiol. 2009. PMID: 19426855 Free PMC article. Review.
Cited by
-
Recognition of Cell Wall Mannosylated Components as a Conserved Feature for Fungal Entrance, Adaptation and Survival Within Trophozoites of Acanthamoeba castellanii and Murine Macrophages.Front Cell Infect Microbiol. 2022 May 31;12:858979. doi: 10.3389/fcimb.2022.858979. eCollection 2022. Front Cell Infect Microbiol. 2022. PMID: 35711659 Free PMC article.
-
Evidence for branching in cryptococcal capsular polysaccharides and consequences on its biological activity.Mol Microbiol. 2011 Feb;79(4):1101-17. doi: 10.1111/j.1365-2958.2010.07511.x. Epub 2011 Jan 5. Mol Microbiol. 2011. PMID: 21208301 Free PMC article.
-
In Vitro Analysis of Metabolites Secreted during Infection of Lung Epithelial Cells by Cryptococcus neoformans.PLoS One. 2016 Apr 7;11(4):e0153356. doi: 10.1371/journal.pone.0153356. eCollection 2016. PLoS One. 2016. PMID: 27054608 Free PMC article.
-
Ubiquitin Degradation of the AICAR Transformylase/IMP Cyclohydrolase Ade16 Regulates the Sexual Reproduction of Cryptococcus neoformans.J Fungi (Basel). 2023 Jun 24;9(7):699. doi: 10.3390/jof9070699. J Fungi (Basel). 2023. PMID: 37504688 Free PMC article.
-
Multiple Disguises for the Same Party: The Concepts of Morphogenesis and Phenotypic Variations in Cryptococcus neoformans.Front Microbiol. 2011 Sep 6;2:181. doi: 10.3389/fmicb.2011.00181. eCollection 2011. Front Microbiol. 2011. PMID: 21922016 Free PMC article.
References
-
- Bhardwaj A. Osmotherapy in neurocritical care. Curr Neurol Neurosci Rep. 2007;7:513–521. - PubMed
-
- Blackstock R, Buchanan KL, Cherniak R, Mitchell TG, Wong B, Bartiss A, et al. Pathogenesis of Cryptococcus neoformans is associated with quantitative differences in multiple virulence factors. Mycopathologia. 1999;147:1–11. - PubMed
-
- Casadevall A, Perfect J. Cryptococcus neoformans. Washington, DC: ASM Press; 1998b.
Publication types
MeSH terms
Substances
Grants and funding
LinkOut - more resources
Full Text Sources
