. 2010 Jan 13;11(1):R5.
doi: 10.1186/gb-2010-11-1-r5.

Rapid chromosome territory relocation by nuclear motor activity in response to serum removal in primary human fibroblasts

Affiliations

Rapid chromosome territory relocation by nuclear motor activity in response to serum removal in primary human fibroblasts

Ishita S Mehta et al. Genome Biol. .

Abstract

Background: Radial chromosome positioning in interphase nuclei is nonrandom and can alter according to developmental, differentiation, proliferation, or disease status. However, it is not yet clear when and how chromosome repositioning is elicited.

Results: By investigating the positioning of all human chromosomes in primary fibroblasts that have left the proliferative cell cycle, we have demonstrated that in cells made quiescent by reversible growth arrest, chromosome positioning is altered considerably. We found that with the removal of serum from the culture medium, chromosome repositioning took less than 15 minutes, required energy and was inhibited by drugs affecting the polymerization of myosin and actin. We also observed that when cells became quiescent, the nuclear distribution of nuclear myosin 1 beta was dramatically different from that in proliferating cells. If we suppressed the expression of nuclear myosin 1 beta by using RNA-interference procedures, the movement of chromosomes after 15 minutes in low serum was inhibited. When high serum was restored to the serum-starved cultures, chromosome repositioning was evident only after 24 to 36 hours, and this coincided with a return to a proliferating distribution of nuclear myosin 1 beta.

Conclusions: These findings demonstrate that genome organization in interphase nuclei is altered considerably when cells leave the proliferative cell cycle and that repositioning of chromosomes relies on efficient functioning of an active nuclear motor complex that contains nuclear myosin 1 beta.


Figures

Figure 1
Figure 1
Chromosome positioning in proliferating interphase nuclei. Proliferating human dermal fibroblasts (HDFs) cultures were subjected to 2D- or 3D-fluorescence in situ hybridization (FISH) to delineate and analyze the nuclear location of chromosomes 10, 13, 18, and X. In panels (a-d), the chromosome territories are revealed in green with a single chromosome territory for chromosome X, because the HDFs are male in origin. The red antibody staining is the nuclear distribution of the proliferative marker anti-pKi-67, the presence of which denotes a cell in the proliferative cell cycle. DAPI (4',6-diamidino-2-phenylindole) in blue is a DNA intercalator dye and reveals the nuclear DNA. Scale bar = 10 μm. The histograms in panels (e-h) display the distribution of the chromosome signal in 50 to 70 nuclei for each chromosome for 2D FISH, as analyzed with erosion analysis. This analysis divides each nucleus into five concentric shells of equal area, with shell 1 being the most peripheral shell, and shell 5 being the most interior shell [4-6,9]. The percentage of chromosome signal measured in each shell was divided by the percentage of DAPI signal in that shell. Bars represent the mean normalized proportion (percentage) of chromosome signal for each human chromosome. Error bars represent the standard error of the mean (SEM). Panels i and j display 3D projections of 0.2-μm optical sections through 3D preserved nuclei subjected to 3D-FISH and imaged with confocal laser scanning microscopy. The chromosome territories are displayed in red, and proliferating cells also were selected with positive anti-pKi-67 staining (not shown in reconstruction). Scale bar = 10 μm. The line graph in panel (k) displays a frequency distribution of micrometers from the geometric center of the chromosome territories to the nearest nuclear periphery, as defined by DAPI staining. Images for 20 nuclei were analyzed.
Figure 2
Figure 2
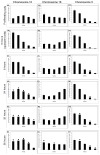
Chromosome positioning in quiescent interphase nuclei. Representative images displaying nuclei prepared for fluorescence in situ hybridization (2D-FISH), with whole-chromosome painting probes (green), and nuclear DNA is counterstained with 4',6-diamidino-2-phenylindole (DAPI) (blue). The cells were subjected to indirect immunofluorescence with anti-pKi-67 antibodies, and negative cells were selected. Cells were placed in low serum (0.5%) for 7 days, before fixation with methanol:acetic acid (3:1). The numbers (or letters) on the left side of each panel indicate the chromosome that has been hybridized. Scale bar = 10 μm.
Figure 3
Figure 3
Analysis of radial chromosome positioning in quiescent cell nuclei. Histograms displaying chromosome positions in primary human quiescent fibroblast nuclei. The 50 to 70 nuclei per chromosome were subjected to erosion analysis, which divides each nucleus into five concentric shells of equal area, with shell 1 being the most peripheral shell, and shell 5 being the most interior shell [4-6,9]. The percentage of chromosome signal measured in each shell was divided by the percentage of 4',6-diamidino-2-phenylindole (DAPI) signal in that shell. Bars represent the mean normalized proportion (percentage) of chromosome signal for each human chromosome. Error bars represent the standard error of mean (SEM).
Figure 4
Figure 4
Rapid repositioning of chromosomes after removal of serum. Chromosomes move rapidly in proliferating cells placed in low serum. The nuclear locations of human chromosomes 10 (a-d), 13 (e-h), 18 (i-l), and X (m-p) were analyzed in normal fibroblast cell nuclei fixed for 2D-FISH (fluorescence in situ hybridization) after incubation in medium containing low serum (0.5%) for 0, 5, 10, and 15 minutes. The filled-in squares indicate significance difference (P < 0.05) when compared with control proliferating fibroblast cell nuclei.
Figure 5
Figure 5
Restoration of proliferative chromosome position after restimulation of G0 cells. The relocation of chromosomes to their proliferative nuclear location takes 24+ hours for chromosome 10 and 36 hours for chromosome 18. Proliferating cells (a, g, m) were placed in low serum (0.5%) for 7 days (b, h, n) and then restimulated to enter the proliferative cell cycle with the readdition of high serum. Samples were taken at 8 hours (c, i, o), 24 hours (d, j, p), 32 hours (e, k, q), and 36 hours (f, l, r) after restimulation. The graphs display the normalized distribution of chromosome signal in each of the five shells. Shell 1 is the nuclear periphery, and shell 5 is the innermost region of the nucleus. The solid squares represent a significant difference (P < 0.05) for that shell when compared with the equivalent shell for the time 0 data (G0 data) for the erosion analysis.
Figure 6
Figure 6
Chromosome repositioning requires energy. The relocation of human chromosomes 10 and 18 after incubation in low serum is energy dependent. The nuclear location of human chromosomes 10, 18, and X in were determined in normal human proliferating cell nuclei treated with ouabain (ATPase inhibitor) (a), AG10 (GTPase inhibitor) (b), or a combination of both (c) before and during incubation in low serum for 15 minutes. Normal control analysis data without any treatment is displayed in (d). The error bars show the standard error of the mean. The stars indicate a significant difference (P < 0.05) from cells treated only with the inhibitor.
Figure 7
Figure 7
Chromosome repositioning requires nuclear myosin and actin. The relocation of human chromosomes 10 and 18 after incubation in low serum is myosin and actin dependent. The nuclear locations of chromosomes 10, 18, and X were determined in normal human proliferating cell nuclei treated with latrunculin A and phalloidin oleate (inhibitors of actin polymerisation) (a, b) and BDM and jasplakinolide (inhibitors of myosin polymerization) (c, d) before and during incubation in low serum for 15 minutes. The error bars show the standard error of the mean. The stars indicate a significant difference (P < 0.05) from cells treated only with the inhibitor. Normal control analysis data without any treatment is displayed in (e).
Figure 8
Figure 8
Suppression of nuclear myosin expression by short interference RNAs (siRNAs). Normal human dermal fibroblasts (HDFs) were transfected with negative control or MYO1C targeting siRNA (double transfection) and samples for immunofluorescence staining and 2D-FISH (fluorescence in situ hybridization) were fixed 48 hours after the final transfection. Representative images of nuclei stained for anti-NMIβ (red) in control (g, h, m, n) cells transfected with negative control siRNA (i, j, o, p) and in cells transfected with MYO1C siRNA (k, l, q, r) after 0 and 15 minutes of serum starvation are displayed. The percentage of nuclei that are positive for NM1β in controls, in cells transfected with negative control siRNA, and in cells transfected with MYO1C siRNA are displayed in the adjacent table (s).
Figure 9
Figure 9
Chromosome repositioning is inhibited by short interference RNA (siRNA) that suppresses nuclear myosin1β. Chromosome positioning was determined with 2D-FISH (fluorescence in situ hybridization) and erosion analysis, and the normalized position data plotted as histograms in control cells, in cells transfected with the negative control, and in cells transfected with the MYO1C siRNA construct. In control human dermal fibroblasts (HDFs) and in HDFs transfected with negative control, siRNA chromosome 10 is repositioned from an intermediate nuclear location (a and g, respectively) to the nuclear periphery (d, j) after 15 minutes of incubation in low serum. Chromosome 18 territories, conversely, are repositioned from the nuclear periphery (b, h) to the nuclear interior (e, k) after 15 minutes of incubation in low serum in control HDFs and in HDFs transfected with negative control siRNA. In HDFs transfected with the MYO1C siRNA construct, chromosomes 10 (m, p) and 18 (n, q) do not show repositioning after 15 minutes of incubation in low serum. Chromosome X remains at the nuclear periphery at all times (c, f, i, l, o, r). Unpaired, unequal variances two-tailed Students t tests were performed to assess statistical differences. The solid squares indicate a significant difference (P < 0.05) from cells not incubated in, and the solid circles indicate a significant difference (P < 0.05) from control HDFs.
Figure 10
Figure 10
Anti-nuclear myosin 1b (NM1β) staining patterns in proliferating cells, quiescent cells, and after restimulation. Normal 2DD human dermal fibroblasts (HDFs) were serum starved for 7 days to induce quiescence. The cells were then restimulated with fresh serum, and samples were collected at 0, 24, 36 and 48 hours after serum restoration. Samples were also collected before serum withdrawal (proliferating cells). The samples were then fixed with methanol/acetone (1:1), and the distribution of NMIβ was assessed by performing an indirect immunofluorescence assay for NMIβ. Images in (a, c) display the distribution of NMIβ in proliferating cells, whereas those in (d and f) show the distribution of NMIβ after 0, 24, 36 and 48 hours after restimulation of quiescent fibroblasts. The table (p) displays the percentage of cells displaying various patterns of NMIβ staining after restimulation. Error is indicated by standard deviation. Scale bar = 10 μm.

Comment in

Similar articles

Cited by

References

    1. Cremer T, Cremer C. Rise, fall and resurrection of chromosome territories: a historical perspective; part II: fall and resurrection of chromosome territories during the 1950s to 1980s; part III: chromosome territories and the functional nuclear architecture: experiments and models from the 1990s to the present. Eur J Histochem. 2006;50:223–272. - PubMed
    1. Meaburn KJ, Misteli T. Cell biology: chromosome territories. Nature. 2007;445:379–781. doi: 10.1038/445379a. - DOI - PubMed
    1. Foster HA, Bridger JM. The genome and the nucleus: a marriage made by evolution: genome organisation and nuclear architecture. Chromosoma. 2005;114:212–229. doi: 10.1007/s00412-005-0016-6. - DOI - PubMed
    1. Boyle S, Gilchrist S, Bridger JM, Mahy NL, Ellis JA, Bickmore WA. The spatial organization of human chromosomes within the nuclei of normal and emerin-mutant cells. Hum Mol Genet. 2001;10:211–219. doi: 10.1093/hmg/10.3.211. - DOI - PubMed
    1. Bridger JM, Boyle S, Kill IR, Bickmore WA. Re-modelling of nuclear architecture in quiescent and senescent human fibroblasts. Curr Biol. 2000;10:149–152. doi: 10.1016/S0960-9822(00)00312-2. - DOI - PubMed