. 2010 Mar 12;285(11):8138-47.
doi: 10.1074/jbc.M109.065482. Epub 2010 Jan 13.

Initiation of purinergic signaling by exocytosis of ATP-containing vesicles in liver epithelium

Affiliations

Initiation of purinergic signaling by exocytosis of ATP-containing vesicles in liver epithelium

Andrew P Feranchak et al. J Biol Chem. .

Abstract

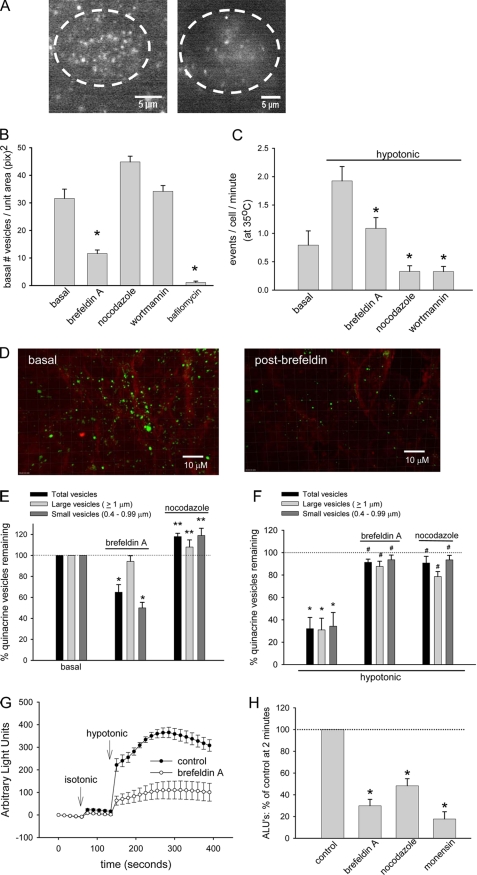
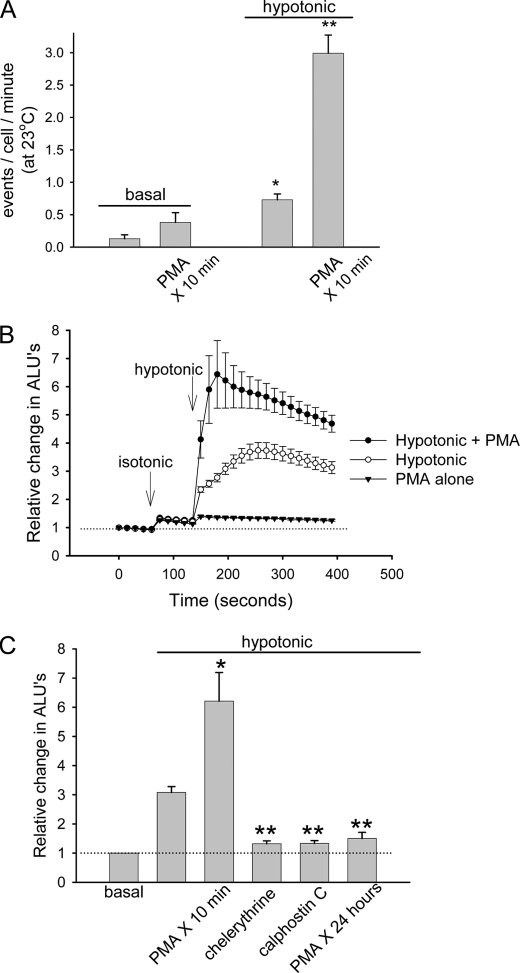
Extracellular ATP represents an important autocrine/paracrine signaling molecule within the liver. The mechanisms responsible for ATP release are unknown, and alternative pathways have been proposed, including either conductive ATP movement through channels or exocytosis of ATP-enriched vesicles, although direct evidence from liver cells has been lacking. Utilizing dynamic imaging modalities (confocal and total internal reflection fluorescence microscopy and luminescence detection utilizing a high sensitivity CCD camera) at different scales, including confluent cell populations, single cells, and the intracellular submembrane space, we have demonstrated in a model liver cell line that (i) ATP release is not uniform but reflects point source release by a defined subset of cells; (ii) ATP within cells is localized to discrete zones of high intensity that are approximately 1 mum in diameter, suggesting a vesicular localization; (iii) these vesicles originate from a bafilomycin A(1)-sensitive pool, are depleted by hypotonic exposure, and are not rapidly replenished from recycling of endocytic vesicles; and (iv) exocytosis of vesicles in response to cell volume changes depends upon a complex series of signaling events that requires intact microtubules as well as phosphoinositide 3-kinase and protein kinase C. Collectively, these findings are most consistent with an essential role for exocytosis in regulated release of ATP and initiation of purinergic signaling in liver cells.


Figures

FIGURE 1.
FIGURE 1.
Point source ATP release. ATP release was detected from confluent HTC cells as focal increases in bioluminescence generated by ATP-dependent luciferin breakdown by luciferase (see supplemental Fig. S1). A, time lapse images of a representative study. Hypotonic solution was perfused onto confluent cells (shown in the first frame, bright field image; scale bar, 50 μm) from a pipette immediately above the cells and to the right of view (indicated by small gray triangle in the last frame). The first image was obtained 2 s after hypotonic addition, and sequential images (from left to right and top to bottom) represent 500-ms intervals. Scale bar, 100 μm. B, relative change in bioluminescence of the example shown in A. Total bioluminescence is shown as a solid line, and one individual burst event is shown as a dotted line. The maximal burst diameter was measured for 31 bursts, and the mean ± S.E. is shown in the inset.
FIGURE 2.
FIGURE 2.
TIRF microscopy reveals a population of submembrane quinacrine-rich vesicles. HTC cells were loaded with quinacrine (10 min), and the submembrane space to a depth of ∼100 nm was illuminated by the evanescent field generated during TIRF. A, time lapse images of single vesicle exocytosis. The dotted white line outlines approximate plasma membrane of one cell. Quinacrine fluorescence appears in focal areas of high concentration ∼1 μm in diameter. In response to hypotonic exposure (33%), vesicles increase in mobility and occasionally fuse with the plasma membrane in a “burst” of fluorescence (see supplemental Fig. S2 of this cell). These sequential images (from left to right and from top to bottom) represent the same cell at 720-ms intervals. A yellow arrowhead marks the position of one representative exocytic event in this field of view. In this example, fluorescence intensity increases sharply, is accompanied by an increase in the diameter of the fluorescent burst, and then rapidly decreases in intensity back to basal levels. Scale bar, 5 μm. B, fluorescence intensity of the single event shown in A was quantified by enclosing the vesicle in a circle and measuring the fluorescence intensity over time. Red hash marks indicate the period of time represented in the images shown in A. C, cumulative data demonstrating total number of events per cell imaged during TIRF at both 23 °C and 35 °C. Black bar, basal events; gray bar, events after hypotonic exposure (33% decrease in osmolality), mean ± S.E. for 35–42 individual cells each. *, hypotonic versus basal at 23 °C, n = 35 each, p < 0.01. #, basal at 35 °C (n = 42) versus basal at 23 °C (n = 35), p < 0.01; **, hypotonic versus basal at 35 °C, n = 42 each, p < 0.01; ##, hypotonic at 35 °C (n = 42) versus hypotonic at 23 °C (n = 35), p < 0.05.
FIGURE 3.
FIGURE 3.
Confocal imaging and three-dimensional reconstruction of HTC cells dually labeled with quinacrine and FM4-64. A, representative single cell. Prehypotonic (top) and 1 min posthypotonic (33%) (bottom) exposure are shown. Large grid squares represent 1 μm. B, representative confluent monolayer. Prehypotonic (top) and 1 min posthypotonic (33%) (bottom) exposure are shown. A spot detection algorithm was applied to count small (0.4–0.99 μm, gray spheres) and large (≥1 μm, blue spheres) vesicles during basal conditions and 1 min after equal volumes of either isotonic or hypotonic buffers were applied. Representative responding cells (defined as a loss of ≥5% of total vesicles) and nonresponding cell are outlined in yellow and white boxes, respectively. Scale bar, 10 μm. C, cumulative data of responding cells reported as percentage of remaining vesicles per cell. Note that only responding cells are included in the analysis. The numbers of total (dark gray bar), large (black bar), and small (light gray bar) vesicles all decreased in response to hypotonic exposure. *, p < 0.01 versus isotonic for each (n = 14).
FIGURE 4.
FIGURE 4.
Formation of quinacrine vesicles. HTC cells labeled with FM4-64 and quinacrine and imaged with confocal microscopy as described under “Experimental Procedures.” A, in the continuous presence of quinacrine (green) and FM4-64 (red), no significant co-localization (yellow) is observed until 45 min (Pearson's coefficient = 0.85). Scale bar, 10 μm. B, bafilomycin A1 inhibits quinacrine vesicle formation and ATP release. First column, quinacrine; second column, FM4-64; third column, merged images. Top row, control; bottom row, postincubation with bafilomycin A1 (4 μm for 30 min). Scale bar, 10 μm. C, bulk ATP release (measured as arbitrary light units) was measured from confluent HTC cells after isotonic and hypotonic (33%) exposures in control (black circles) or after incubation with bafilomycin A1 (open circles). Each point represents mean ± S.E. for n = 7 trials each. *, basal, isotonic, and hypotonic buffer-stimulated ATP release was significantly inhibited, p < 0.01.
FIGURE 5.
FIGURE 5.
Regulation of exocytosis and ATP release. A, representative TIRF image of the submembrane space of a single HTC cell, labeled with quinacrine according to protocol, during control conditions and after incubation with brefeldin A (10 μm for 1 h). B, cumulative data demonstrating basal number of vesicles in submembrane space visualized by TIRF. Incubation with brefeldin A (n = 21) or bafilomycin A1 (4 μm × 30 min, n = 8) significantly decreased the basal number of vesicles. *, p < 0.01 versus basal (n = 21). Nocodazole (n = 25) or wortmannin (n = 30) did not affect basal number of vesicles in submembrane space. C, cumulative data demonstrating number of exocytic events/cell/min during basal conditions and after hypotonic exposure (33% decrease osmolality) during TIRF. Incubation with brefeldin A (10 μm, n = 13), nocodazole (10 μm, n = 25), or wortmannin (50 nm, n = 30) significantly inhibited the number of exocytic events. *, p < 0.01 compared with control (n = 21). D, representative confocal images of confluent HTC cells dually labeled with FM4-64 and quinacrine according to the protocol shown in Fig. 3. Incubation with brefeldin A (10 μm × 1 h) decreased the number of quinacrine-stained vesicles. E, cumulative data demonstrating basal number of vesicles as visualized by confocal microscopy and quantified by a computer algorithm described in the legend to Fig. 3. Incubation with brefeldin A significantly decreased the number of total (black bar) and small (dark gray bar) vesicles (*, p < 0.01 versus basal) but had little effect on large vesicles (n = 11). Incubation with nocodazole (10 μm × 15 min) increased the basal number of vesicles. **, p < 0.05 versus basal (n = 10). F, cumulative data demonstrating number of vesicles remaining after hypotonic exposure. *, p < 0.01 versus basal. Both brefeldin A (n = 11) and nocodazole (n = 10) significantly inhibit the loss of quinacrine-stained vesicles. #, p < 0.05 versus hypotonic control (n = 11). G, bulk ATP release (arbitrary light units) was measured from confluent HTC cells after isotonic and hypotonic (33%) exposures in control (black circles) or after incubation with brefeldin A (open circles). Each point represents mean ± S.E. (n = 6 each). H, cumulative data demonstrating effect of inhibitors of vesicle formation and trafficking on bulk ATP release. Values represent percentage of maximal control ATP release at 2 min. Brefeldin A, nocodazole, and monensin (100 μm) significantly inhibited ATP release in response to hypotonic exposure. *, p < 0.05 versus control, n = 5–6 each.
FIGURE 6.
FIGURE 6.
Regulation of exocytosis and ATP release by PKC. A, HTC cells were labeled with quinacrine and imaged via TIRF microscopy according to the protocol in Fig. 2 at 23 °C. Cumulative data represent the number of exocytic events/cell/min. Incubation with PMA (1 μm × 10 min, n = 28) significantly increased the number of hypotonic buffer-stimulated (33% decrease in osmolality) exocytic events versus control (n = 35). *, p < 0.01 versus basal without PMA; **, p < 0.05 versus hypotonic control. B, bulk ATP release (arbitrary light units) was measured from confluent HTC cells after isotonic and hypotonic (33%) exposures in control (open circles) or after incubation with PMA (closed circles). Filled triangles, isotonic exposure followed by PMA exposure (without hypotonic exposure). Each point represents mean ± S.E. (n = 5 trials each). C, cumulative data demonstrating effects of PKC stimulation (PMA 1 μm × 10 min) or inhibition by chelerythrine (20 μm × 15 min), calphostin C (3 μm × 15 min), or PMA (1 μm × 24 h) on hypotonic buffer-stimulated ATP release. Data represent mean ± S.E. of maximal ATP release (n = 5–8 for each). *, hypotonic buffer-stimulated ATP release was significantly increased by PMA, p < 0.05 versus hypotonic control; **, hypotonic buffer-stimulated ATP release was significantly decreased by inhibition of PKC, p < 0.05 versus hypotonic control.

Similar articles

Cited by

References

    1. Schlosser S. F., Burgstahler A. D., Nathanson M. H. (1996) Proc. Natl. Acad. Sci. U.S.A. 93, 9948–9953 - PMC - PubMed
    1. Wang Y., Roman R., Lidofsky S. D., Fitz J. G. (1996) Proc. Natl. Acad. Sci. U.S.A. 93, 12020–12025 - PMC - PubMed
    1. Minagawa N., Nagata J., Shibao K., Masyuk A. I., Gomes D. A., Rodrigues M. A., Lesage G., Akiba Y., Kaunitz J. D., Ehrlich B. E., Larusso N. F., Nathanson M. H. (2007) Gastroenterology 133, 1592–1602 - PMC - PubMed
    1. Roman R. M., Feranchak A. P., Salter K. D., Wang Y., Fitz J. G. (1999) Am. J. Physiol. 276, G1391–G1400 - PubMed
    1. Feranchak A. P., Fitz J. G. (2007) Gastroenterology 133, 1726–1728 - PubMed

Publication types

MeSH terms

LinkOut - more resources