. 2010 Mar 19;285(12):9180-9.
doi: 10.1074/jbc.M109.077958. Epub 2010 Jan 13.

Kruppel-like factor 4 (Klf4) prevents embryonic stem (ES) cell differentiation by regulating Nanog gene expression

Affiliations

Kruppel-like factor 4 (Klf4) prevents embryonic stem (ES) cell differentiation by regulating Nanog gene expression

Peilin Zhang et al. J Biol Chem. .

Abstract

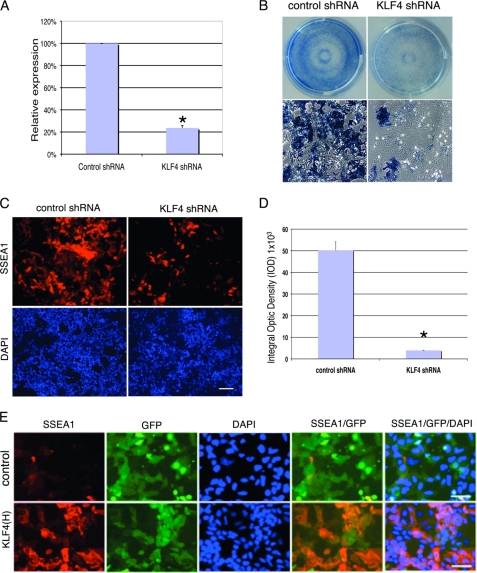
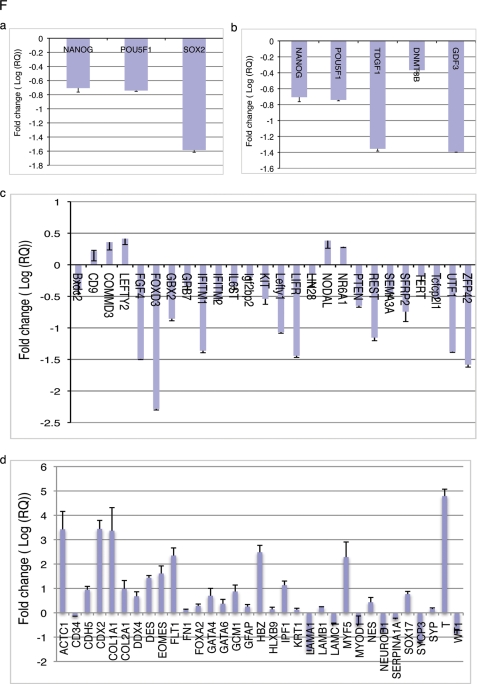
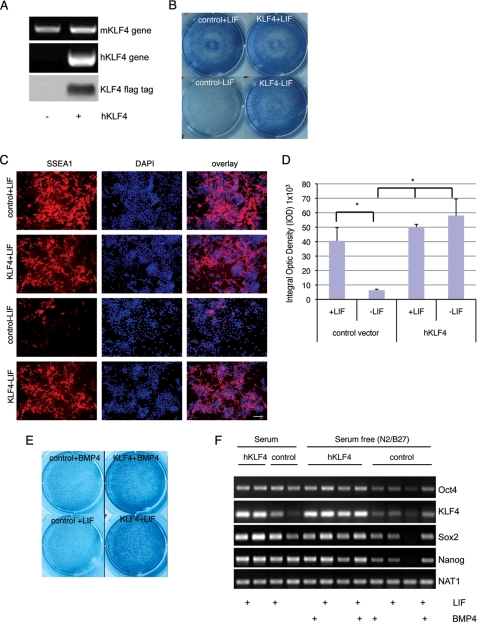
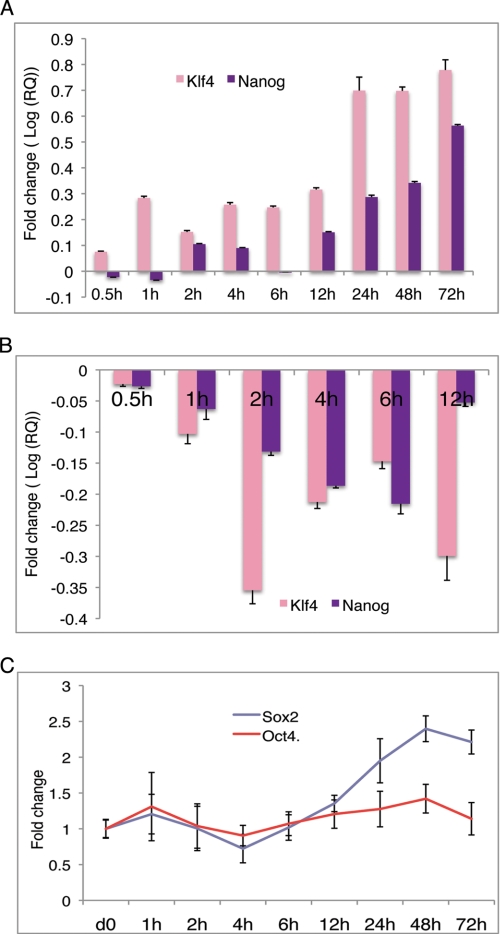
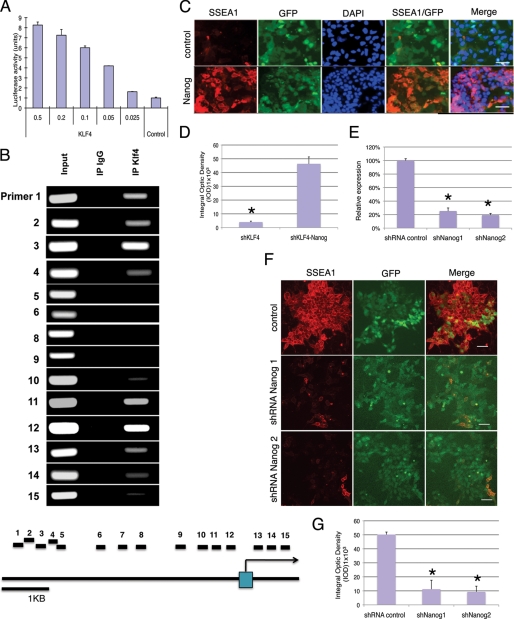
Transcription factor Kruppel-like factor 4 (Klf4) is essential for somatic cell reprogramming. In addition, Klf4 seems to play a redundant role along with other Klf family proteins in embryonic stem (ES) cell self-renewal. However, how Klf4 regulates ES cell self-renewal and somatic cell reprogramming is still poorly understood. Here we report that Klf4 is required for both ES cell self-renewal and maintenance of pluripotency and that the expression of Klf4 prevents ES cell differentiation in response to withdrawal of leukemia inhibitory factor (LIF) or bone morphogenetic protein 4 (BMP4). In addition, Klf4 directly binds to the promoter region of Nanog and regulates its expression. Expression of Nanog prevents ES cell differentiation even when Klf4 gene expression is knocked down. On the other hand, knockdown of Nanog expression induces differentiation of ES cells that overexpress Klf4. Taken together, these results demonstrate that Klf4 functions upstream of Nanog in ES cell self-renewal and in preventing ES cell differentiation.


Figures

FIGURE 1.
FIGURE 1.
Knockdown of Klf4 expression induces differentiation of ES cells. A, quantitative RT-PCR results indicate Klf4 expression was inhibited by Klf4 shRNA by 77.8%. Data are presented as the mean ± S.D. of triplicates. B, AP staining was significantly reduced in Klf4 knockdown cells. Upper panel, whole-well view. Lower panel, higher magnification. C, SSEA1 staining of ES cells was strongly reduced by shKlf4 knockdown. The nuclear signal is shown by DAPI staining. Scale bar: 100 μm. D, quantitative analysis of SSEA1 staining in shKlf4 cells shown in C. SSEA1 signal was quantified by Integral Optic Density (IOD). Data are presented as the mean ± S.D. of triplicates. E, expression of human Klf4 can rescue the knockdown effect of mouse shKlf4 in ES cells. Upper panel, SSEA1 staining was significantly reduced in ES cells infected with shKlf4 and transfected with a control vector plus a GFP expression vector. GFP-positive cells are SSEA1-negative. Lower panel, compared with upper panel, SSEA1 staining increased significantly in ES cells infected with mouse shKlf4 and transfected with human Klf4 plus a GFP expression vector. GFP-positive cells, which expressed human Klf4, are also SSEA1-positive. Scale bar: 50 μm. F, (a) With Klf4 knockdown, expression levels of pluripotency-related genes Nanog, Oct4, and Sox2 decreased. b and c, genes associated with the undifferentiated state and stemness were down-regulated. d, genes associated with the differentiated state were up-regulated. Data are presented as the mean ± S.D. of triplicates.
FIGURE 1.
FIGURE 1.
Knockdown of Klf4 expression induces differentiation of ES cells. A, quantitative RT-PCR results indicate Klf4 expression was inhibited by Klf4 shRNA by 77.8%. Data are presented as the mean ± S.D. of triplicates. B, AP staining was significantly reduced in Klf4 knockdown cells. Upper panel, whole-well view. Lower panel, higher magnification. C, SSEA1 staining of ES cells was strongly reduced by shKlf4 knockdown. The nuclear signal is shown by DAPI staining. Scale bar: 100 μm. D, quantitative analysis of SSEA1 staining in shKlf4 cells shown in C. SSEA1 signal was quantified by Integral Optic Density (IOD). Data are presented as the mean ± S.D. of triplicates. E, expression of human Klf4 can rescue the knockdown effect of mouse shKlf4 in ES cells. Upper panel, SSEA1 staining was significantly reduced in ES cells infected with shKlf4 and transfected with a control vector plus a GFP expression vector. GFP-positive cells are SSEA1-negative. Lower panel, compared with upper panel, SSEA1 staining increased significantly in ES cells infected with mouse shKlf4 and transfected with human Klf4 plus a GFP expression vector. GFP-positive cells, which expressed human Klf4, are also SSEA1-positive. Scale bar: 50 μm. F, (a) With Klf4 knockdown, expression levels of pluripotency-related genes Nanog, Oct4, and Sox2 decreased. b and c, genes associated with the undifferentiated state and stemness were down-regulated. d, genes associated with the differentiated state were up-regulated. Data are presented as the mean ± S.D. of triplicates.
FIGURE 2.
FIGURE 2.
Overexpression of Klf4 prevents differentiation of ES cells in serum and serum-free culture conditions. ES cells were infected with lentivirus expressing human Klf4 or control vector, and then cultured in differentiation conditions for 4 days. A, Human Klf4 (hKlf4) was stably expressed in ES cells. The mouse Klf4 gene (upper panel) and human Klf4 gene (middle panel) were detected by RT-PCR. The human Klf4 protein was detected by immunoblot (IB) with anti-FLAG tag of Klf4 extracts from ES cells infected with hKlf4 lentivirus (lower panel). B, AP staining of ES cells and ES cells expressing human Klf4 cultured in medium containing serum with or without LIF. C, SSEA1 staining of ES cells overexpressing Klf4 or control ES cells under serum-containing conditions with and without LIF addition. Without LIF, SSEA1 staining in control ES cells strongly decreased. However, SSEA1 staining in Klf4-expressing ES cells did not change despite LIF removal. The scale bar represents a distance of 100 μm. D, quantification of IOD of SSEA1staining. Data are presented as the mean ± S.D. of triplications. E, AP staining of ES cells and ES cells expressing human Klf4 cultured in serum-free (N2/B27) medium with either BMP4 or LIF addition. F, pluripotency gene expression analysis in Klf4-expressing ES cells and control ES cells described in B and E. These cells were cultured in the serum-containing condition with or without LIF supplement, or in serum-free conditions with or without BMP4 or LIF or both. The expression of Nanog, Oct4, Sox2, Klf4, and Nat1 was determined by RT-PCR.
FIGURE 3.
FIGURE 3.
Changes in Klf4 expression precede the change in Nanog expression during ES cell differentiation. The expression of Klf4 and Nanog in ES cells and embryoid bodies was determined by quantitative RT-PCR. A, ES cells were cultured under starvation conditions without LIF for overnight. Then LIF was added, followed by a time course analysis of Klf4 and Nanog expression. B, time course analysis of Klf4 and Nanog expression upon LIF withdrawal. C, expression of Sox2 and Oct4 levels did not change upon LIF withdrawal.
FIGURE 4.
FIGURE 4.
Klf4 functions upstream of Nanog to prevent ES cell differentiation. A, expression of Klf4 activates the PNanog-luciferase reporter in a dose-dependent manner. B, ChIP analysis indicates that Klf4 binds to both the proximal and distal regions of the Nanog promoter. The location of primers (C) Nanog expression inhibited ES cell differentiation induced by Klf4 shRNA expression. Upper panel, SSEA1 staining was strongly reduced in ES cells infected with shKlf4 and then transfected with control vector. GFP (control vector)-positive cells are not SSEA1-positive. Lower panel, SSEA1 staining increased significantly in Klf4 shRNA-expressing ES cells transfected with a Nanog expression construct. GFP-positive (Nanog-expressing) cells are also SSEA1-positive. Scale bar: 50 μm. D, quantitative analysis of IOD of SSEA1 staining shown in C. Data are presented as the mean ± S.D. of triplicates. E, Nanog shRNA1 and shRNA2 inhibit Nanog expression by 74 and 80%, respectively. Expression of Nanog was determined by real-time RT-PCR. Data are presented as the mean ± S.D. of triplicates. F, Nanog shRNA expression induces differentiation in Klf4-expressing ES cells. A Nanog shRNA expression construct or a control vector was co-transfected with a GFP construct into Klf4-expressing ES cells. SSEA1 staining was performed 4 days after transfection. shNanog-positive cells (middle and lower panels) were SSEA1-negative, whereas control cells (upper panel) were SSEA1-positive. Scale bar: 50 μm. G, quantitation of SSEA1 staining shown in F. Data are presented as the mean ± S.D. of triplicates.

References

    1. Evans M. J., Kaufman M. H. (1981) Nature 292, 154–156 - PubMed
    1. Martin G. R. (1981) Proc. Natl. Acad. Sci. U.S.A. 78, 7634–7638 - PMC - PubMed
    1. Nichols J., Zevnik B., Anastassiadis K., Niwa H., Klewe-Nebenius D., Chambers I., Schöler H., Smith A. (1998) Cell 95, 379–391 - PubMed
    1. Niwa H., Miyazaki J., Smith A. G. (2000) Nat. Genet. 24, 372–376 - PubMed
    1. Ambrosetti D. C., Basilico C., Dailey L. (1997) Mol. Cell Biol. 17, 6321–6329 - PMC - PubMed

Publication types